| Red | Green | Blue | |
| z | 17.64 | ||
| znorm | Inf | ||
| sky | -Inf | -Inf | -NaN |
| S/N | 27.0 | 47.2 | 52.5 |
| S/N(c) | 0.0 | 0.0 | 0.0 |
| SN(E/C) |
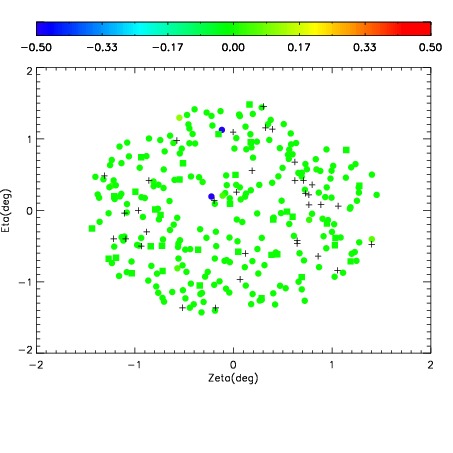
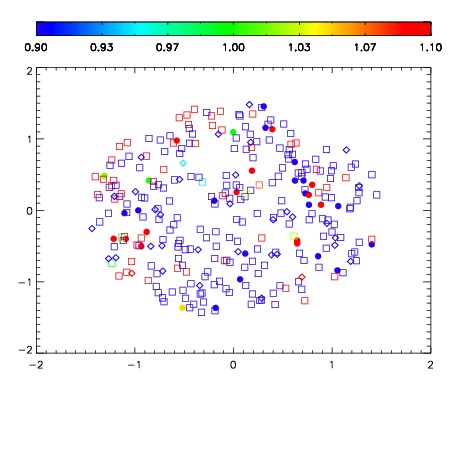
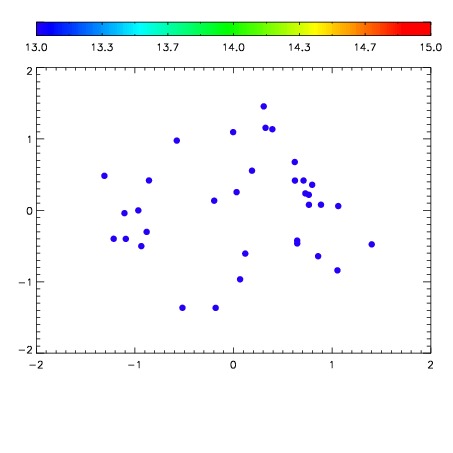

| Frame | Nreads | Zeropoints | Mag plots | Spatial mag deviation | Spatial sky 16325A emission deviations (filled: sky, open: star) | Spatial sky continuum emission | Spatial sky telluric CO2 absorption deviations (filled: H < 10) | |||||||||||||||||||||||
| 0 | 0 |
|
|
|
|
|
|
| IPAIR | NAME | SHIFT | NEWSHIFT | S/N | NAME | SHIFT | NEWSHIFT | S/N |
| 0 | 17740032 | 0.519347 | 0.00000 | 18.1714 | 17740033 | 0.00434182 | 0.515005 | 18.1911 |
| 1 | 17740024 | 0.515999 | 0.00334799 | 18.7850 | 17740025 | 0.00301033 | 0.516337 | 18.8232 |
| 2 | 17740035 | 0.515205 | 0.00414199 | 18.7675 | 17740034 | 0.00412041 | 0.515227 | 18.6589 |
| 3 | 17740031 | 0.517930 | 0.00141704 | 18.3451 | 17740030 | 0.00415153 | 0.515195 | 18.2720 |
| 4 | 17740027 | 0.516996 | 0.00235099 | 18.1042 | 17740026 | 0.00266554 | 0.516681 | 18.1222 |
| 5 | 17740028 | 0.518401 | 0.000945985 | 17.9649 | 17740029 | 0.00381184 | 0.515535 | 18.0708 |
| 6 | 17740023 | 0.516464 | 0.00288302 | 17.8441 | 17740022 | 0.00000 | 0.519347 | 17.7573 |