| Red | Green | Blue | |
| z | 17.64 | ||
| znorm | Inf | ||
| sky | -Inf | -Inf | -NaN |
| S/N | 17.6 | 30.9 | 35.7 |
| S/N(c) | 0.0 | 0.0 | 0.0 |
| SN(E/C) |
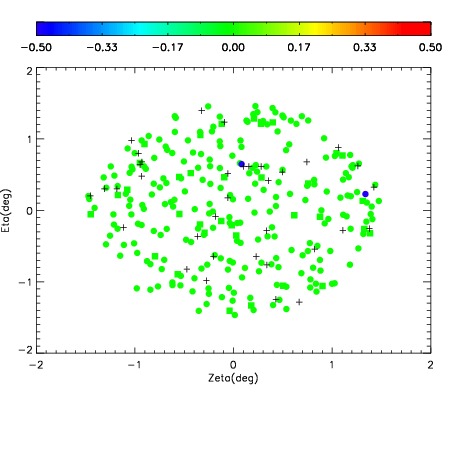
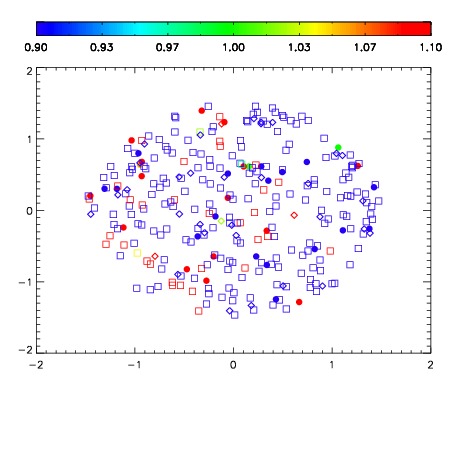
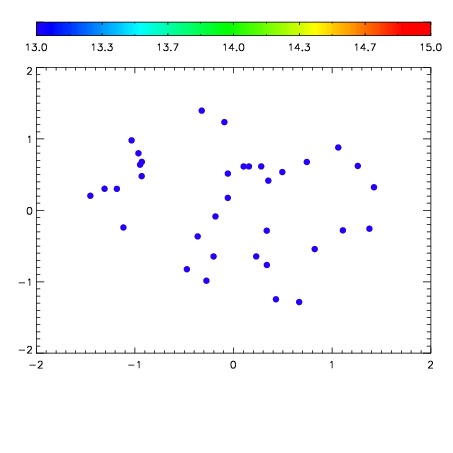

| Frame | Nreads | Zeropoints | Mag plots | Spatial mag deviation | Spatial sky 16325A emission deviations (filled: sky, open: star) | Spatial sky continuum emission | Spatial sky telluric CO2 absorption deviations (filled: H < 10) | |||||||||||||||||||||||
| 0 | 0 |
|
|
|
|
|
|
| IPAIR | NAME | SHIFT | NEWSHIFT | S/N | NAME | SHIFT | NEWSHIFT | S/N |
| 0 | 17710044 | 0.00301627 | 0.00000 | 18.0808 | 17710039 | -0.505628 | 0.508644 | 18.1198 |
| 1 | 17710041 | -7.93426e-05 | 0.00309561 | 18.2059 | 17710042 | -0.502754 | 0.505770 | 18.2039 |
| 2 | 17710040 | -0.000712607 | 0.00372888 | 18.1257 | 17710043 | -0.503556 | 0.506572 | 18.1592 |
| 3 | 17710037 | 0.00000 | 0.00301627 | 18.0507 | 17710038 | -0.505850 | 0.508866 | 17.9792 |