| Red | Green | Blue | |
| z | 17.64 | ||
| znorm | Inf | ||
| sky | -Inf | -Inf | -NaN |
| S/N | 24.9 | 44.2 | 49.2 |
| S/N(c) | 0.0 | 0.0 | 0.0 |
| SN(E/C) |
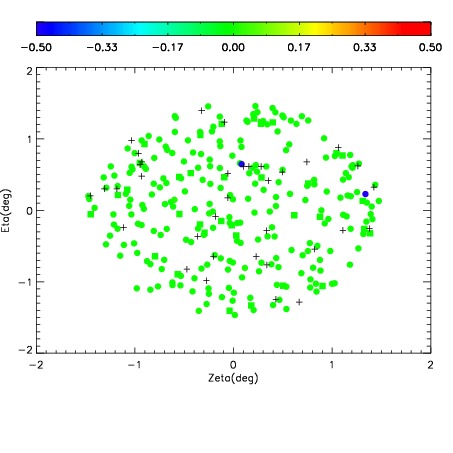
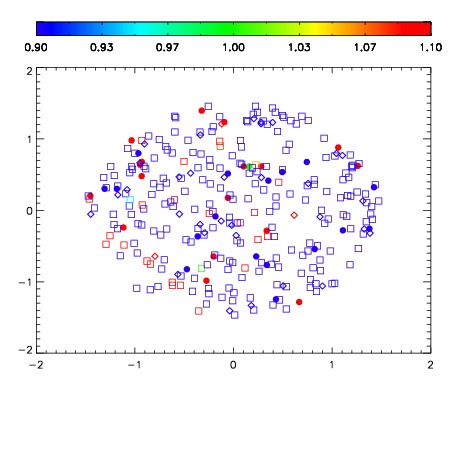
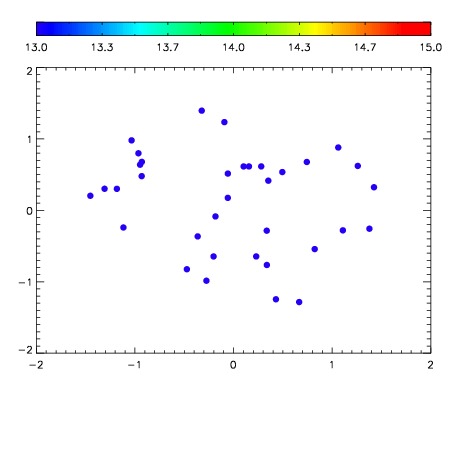

| Frame | Nreads | Zeropoints | Mag plots | Spatial mag deviation | Spatial sky 16325A emission deviations (filled: sky, open: star) | Spatial sky continuum emission | Spatial sky telluric CO2 absorption deviations (filled: H < 10) | |||||||||||||||||||||||
| 0 | 0 |
|
|
|
|
|
|
| IPAIR | NAME | SHIFT | NEWSHIFT | S/N | NAME | SHIFT | NEWSHIFT | S/N |
| 0 | 17730032 | 0.00339676 | 0.00000 | 18.2474 | 17730033 | -0.508221 | 0.511618 | 18.3336 |
| 1 | 17730028 | 0.00000 | 0.00339676 | 18.6336 | 17730029 | -0.509307 | 0.512704 | 18.6810 |
| 2 | 17730035 | 0.00162155 | 0.00177521 | 18.4965 | 17730034 | -0.508408 | 0.511805 | 18.5431 |
| 3 | 17730036 | 0.00289398 | 0.000502780 | 18.4222 | 17730037 | -0.507654 | 0.511051 | 18.4124 |
| 4 | 17730039 | 0.00316931 | 0.000227450 | 18.3915 | 17730038 | -0.507529 | 0.510926 | 18.3787 |
| 5 | 17730031 | 0.00211327 | 0.00128349 | 18.0874 | 17730030 | -0.509394 | 0.512791 | 18.1760 |