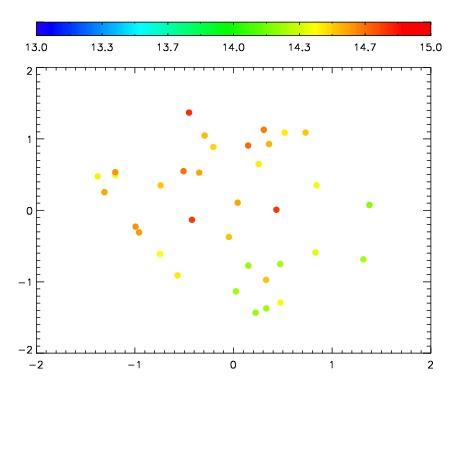
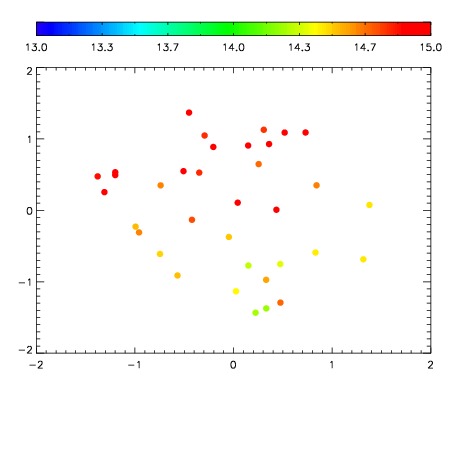
| Frame | Nreads | Zeropoints | Mag plots
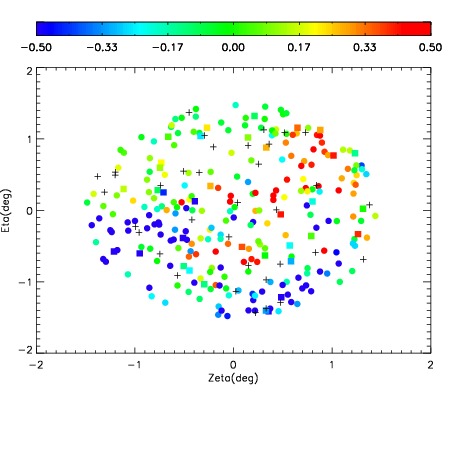
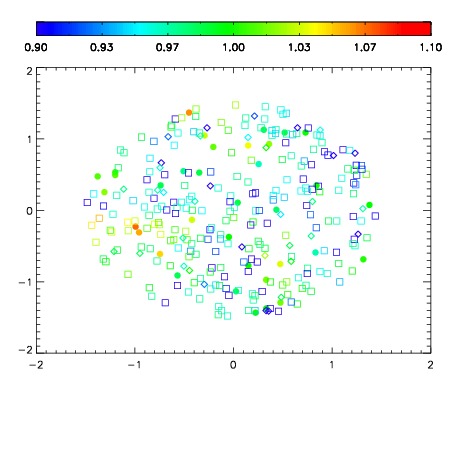
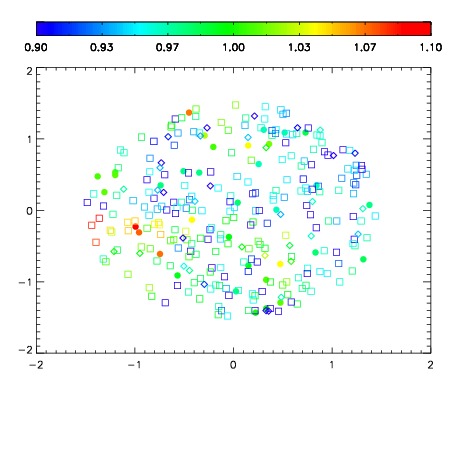
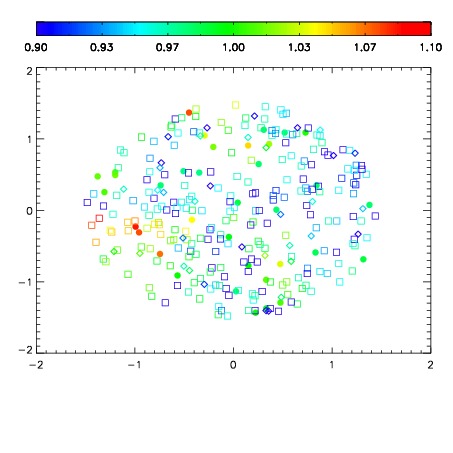
| Spatial mag deviation
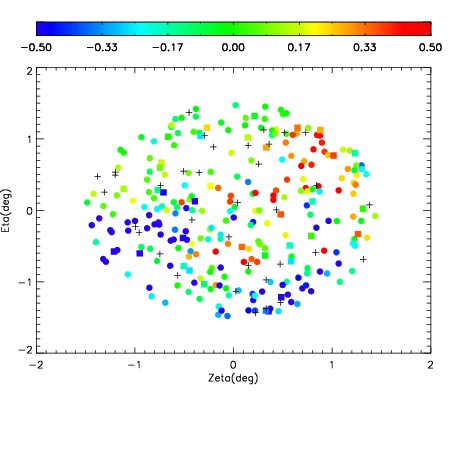
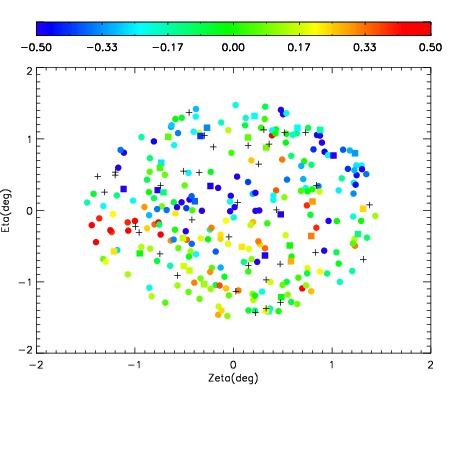
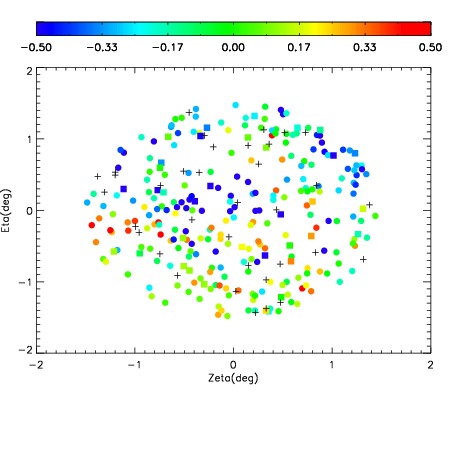
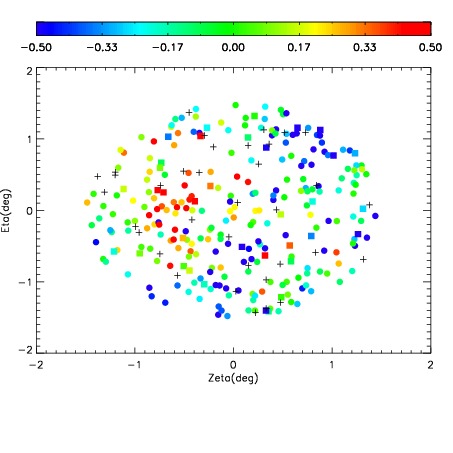
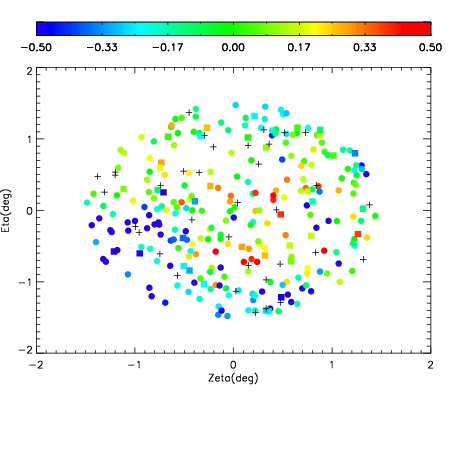
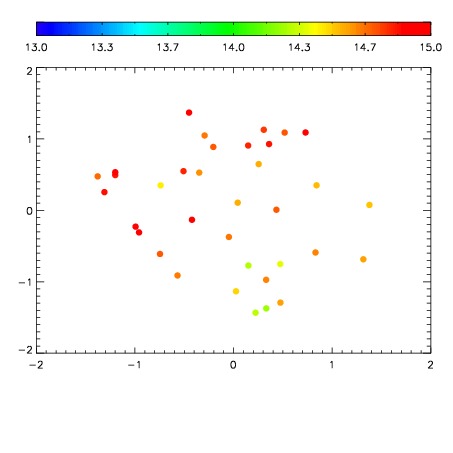
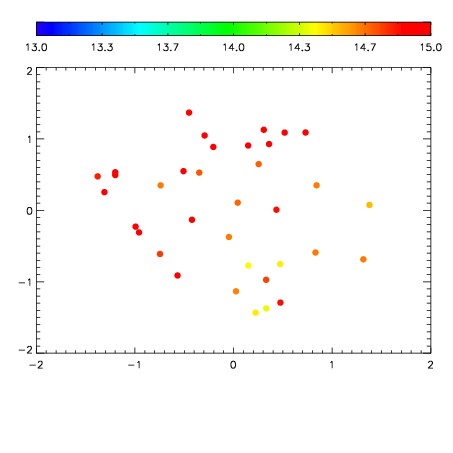
| Spatial sky 16325A emission deviations (filled: sky, open: star)
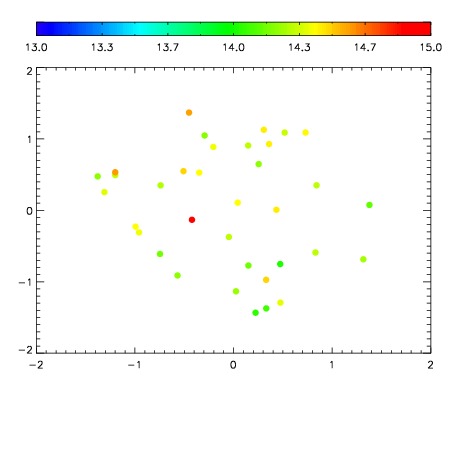
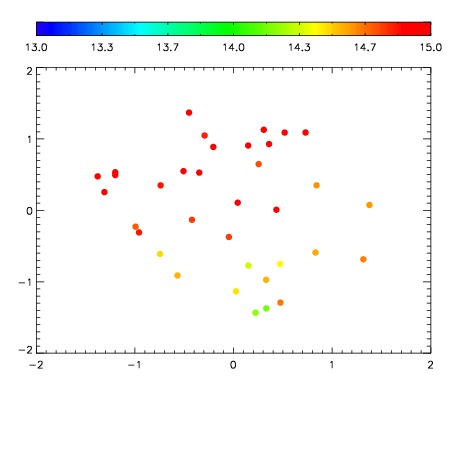
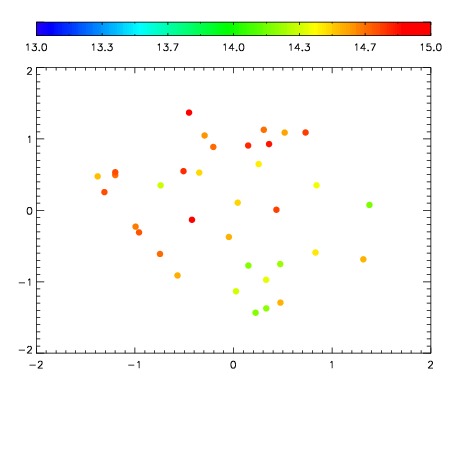
| Spatial sky continuum emission
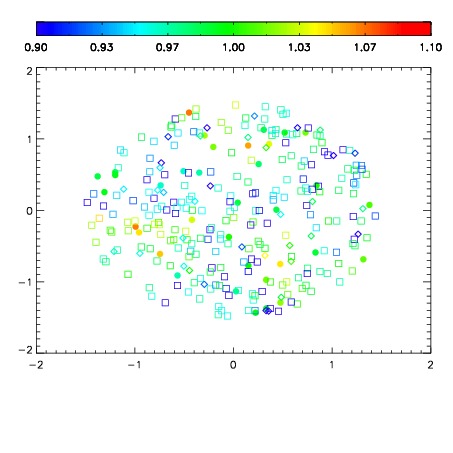
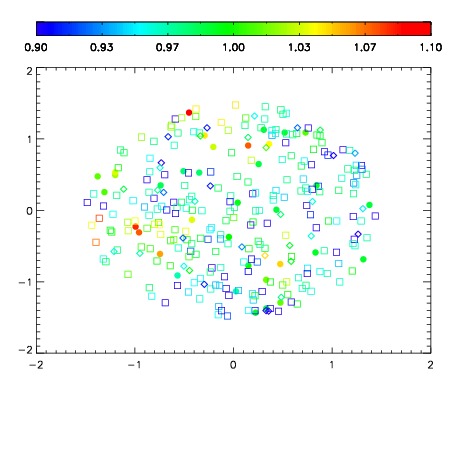
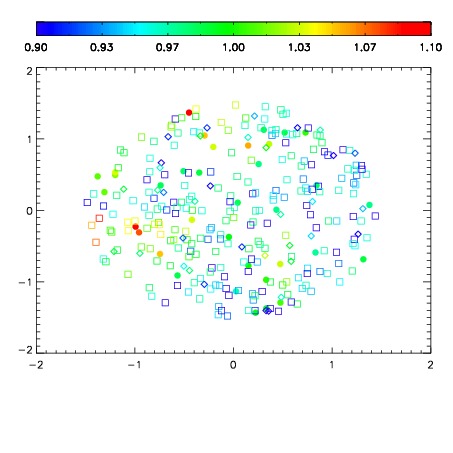
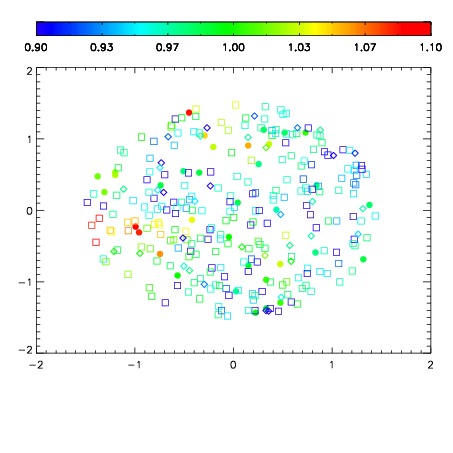
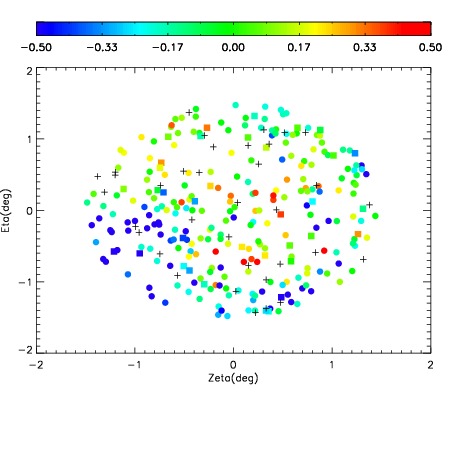
| Spatial sky telluric CO2 absorption deviations (filled: H < 10)
|
| 17760038
| 42
| | Red | Green | Blue
| | z | | 18.43
| | znorm | | 14.38
| | sky | 14.6 | 14.3 | 14.5
| | S/N | 11.7 | 20.0 | 22.7
| | S/N(c) | 17.2 | 13.1 | 14.3
| | SN(E/C) 0.76
|
| 
| 
| 
| 
| 
|
| 17760039
| 42
| | Red | Green | Blue
| | z | | 18.41
| | znorm | | 14.35
| | sky | 14.6 | 14.5 | 14.8
| | S/N | 11.2 | 19.2 | 21.9
| | S/N(c) | 16.6 | 12.8 | 14.0
| | SN(E/C) 0.79
|
| 
| 
| 
| 
| 
|
| 17760040
| 42
| | Red | Green | Blue
| | z | | 18.49
| | znorm | | 14.43
| | sky | 14.9 | 14.7 | 14.6
| | S/N | 10.6 | 17.9 | 21.2
| | S/N(c) | 19.0 | 14.3 | 15.5
| | SN(E/C) 0.78
|
| 
| 
| 
| 
| 
|
| 17760041
| 42
| | Red | Green | Blue
| | z | | 18.52
| | znorm | | 14.46
| | sky | 15.0 | 14.8 | 14.8
| | S/N | 10.6 | 18.0 | 20.4
| | S/N(c) | 19.3 | 14.4 | 15.7
| | SN(E/C) 0.78
|
| 
| 
| 
| 
| 
|
| 17760042
| 42
| | Red | Green | Blue
| | z | | 18.53
| | znorm | | 14.47
| | sky | 14.7 | 14.7 | 14.7
| | S/N | 11.7 | 20.7 | 22.7
| | S/N(c) | 18.4 | 14.1 | 14.9
| | SN(E/C) 0.82
|
| 
| 
| 
| 
| 
|
| 17760043
| 42
| | Red | Green | Blue
| | z | | 18.48
| | znorm | | 14.42
| | sky | 14.8 | 14.6 | 14.7
| | S/N | 11.3 | 19.7 | 22.3
| | S/N(c) | 18.0 | 14.0 | 14.8
| | SN(E/C) 0.79
|
| 
| 
| 
| 
| 
|
| 17760044
| 42
| | Red | Green | Blue
| | z | | 18.62
| | znorm | | 14.56
| | sky | 14.8 | 14.7 | 14.8
| | S/N | 12.8 | 21.6 | 24.5
| | S/N(c) | 18.9 | 14.6 | 15.5
| | SN(E/C) 0.70
|
| 
| 
| 
| 
| 
|
| 17760045
| 42
| | Red | Green | Blue
| | z | | 18.56
| | znorm | | 14.50
| | sky | 14.8 | 14.9 | 14.4
| | S/N | 12.5 | 20.9 | 24.0
| | S/N(c) | 18.1 | 14.3 | 15.2
| | SN(E/C) 0.78
|
| 
| 
| 
| 
| 
|