| Red | Green | Blue | |
| z | 17.64 | ||
| znorm | Inf | ||
| sky | -NaN | -Inf | -Inf |
| S/N | 21.3 | 36.9 | 43.3 |
| S/N(c) | 0.0 | 0.0 | 0.0 |
| SN(E/C) |
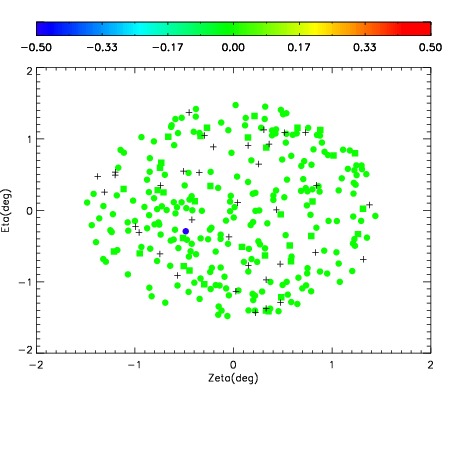
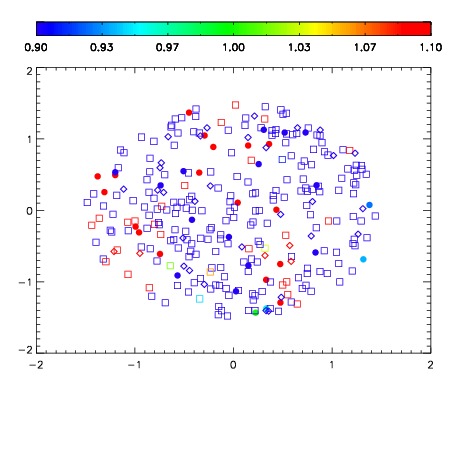


| Frame | Nreads | Zeropoints | Mag plots | Spatial mag deviation | Spatial sky 16325A emission deviations (filled: sky, open: star) | Spatial sky continuum emission | Spatial sky telluric CO2 absorption deviations (filled: H < 10) | |||||||||||||||||||||||
| 0 | 0 |
|
|
|
|
|
|
| IPAIR | NAME | SHIFT | NEWSHIFT | S/N | NAME | SHIFT | NEWSHIFT | S/N |
| 0 | 17760040 | 0.512788 | 0.00000 | 18.4357 | 17760041 | 0.00368603 | 0.509102 | 18.4522 |
| 1 | 17760044 | 0.512208 | 0.000580013 | 18.5517 | 17760045 | 0.00448757 | 0.508300 | 18.5095 |
| 2 | 17760043 | 0.511832 | 0.000955999 | 18.4223 | 17760042 | 0.00399522 | 0.508793 | 18.4501 |
| 3 | 17760039 | 0.511966 | 0.000822008 | 18.3691 | 17760038 | 0.00000 | 0.512788 | 18.3919 |