| Red | Green | Blue | |
| z | 17.64 | ||
| znorm | Inf | ||
| sky | -Inf | -NaN | -NaN |
| S/N | 23.7 | 42.0 | 49.0 |
| S/N(c) | 0.0 | 0.0 | 0.0 |
| SN(E/C) |
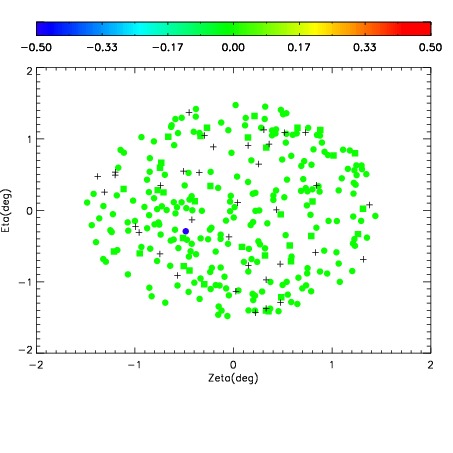
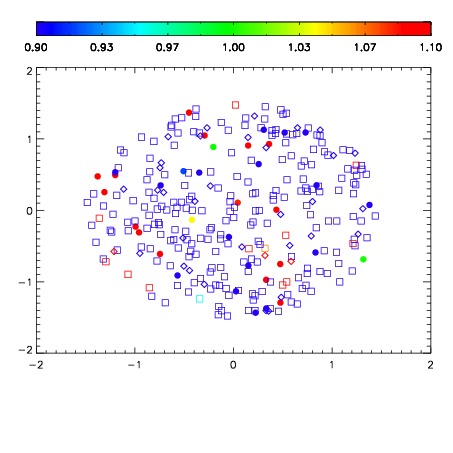
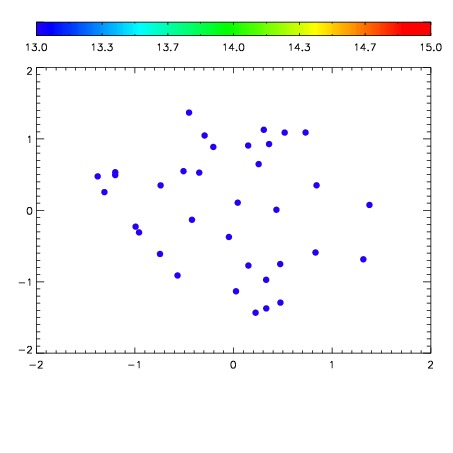

| Frame | Nreads | Zeropoints | Mag plots | Spatial mag deviation | Spatial sky 16325A emission deviations (filled: sky, open: star) | Spatial sky continuum emission | Spatial sky telluric CO2 absorption deviations (filled: H < 10) | |||||||||||||||||||||||
| 0 | 0 |
|
|
|
|
|
|
| IPAIR | NAME | SHIFT | NEWSHIFT | S/N | NAME | SHIFT | NEWSHIFT | S/N |
| 0 | 17780028 | 0.000811003 | 0.00000 | 18.0635 | 17780029 | -0.510037 | 0.510848 | 18.1979 |
| 1 | 17780024 | -0.000217363 | 0.00102837 | 18.8320 | 17780025 | -0.509949 | 0.510760 | 18.7883 |
| 2 | 17780031 | -0.00179582 | 0.00260682 | 18.7086 | 17780030 | -0.510489 | 0.511300 | 18.6896 |
| 3 | 17780023 | 0.000110672 | 0.000700331 | 17.9683 | 17780026 | -0.509550 | 0.510361 | 17.9949 |
| 4 | 17780027 | 0.000419959 | 0.000391044 | 17.8689 | 17780022 | -0.510456 | 0.511267 | 17.9842 |
| 5 | 17780020 | 0.00000 | 0.000811003 | 17.7771 | 17780021 | -0.510422 | 0.511233 | 17.8603 |