| Red | Green | Blue | |
| z | 17.64 | ||
| znorm | Inf | ||
| sky | -NaN | -Inf | -Inf |
| S/N | 35.0 | 63.4 | 71.8 |
| S/N(c) | 0.0 | 0.0 | 0.0 |
| SN(E/C) |
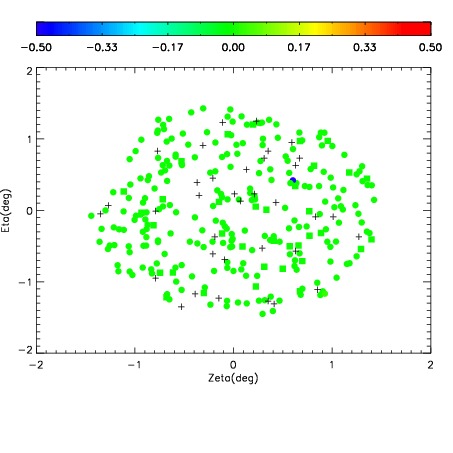
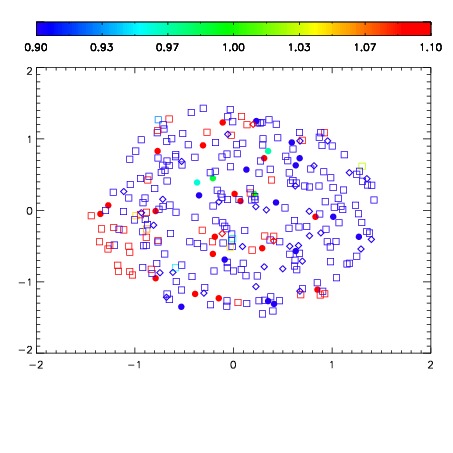


| Frame | Nreads | Zeropoints | Mag plots | Spatial mag deviation | Spatial sky 16325A emission deviations (filled: sky, open: star) | Spatial sky continuum emission | Spatial sky telluric CO2 absorption deviations (filled: H < 10) | |||||||||||||||||||||||
| 0 | 0 |
|
|
|
|
|
|
| IPAIR | NAME | SHIFT | NEWSHIFT | S/N | NAME | SHIFT | NEWSHIFT | S/N |
| 0 | 17480033 | 0.512766 | 0.00000 | 17.7848 | 17480034 | 0.000980721 | 0.511785 | 17.7969 |
| 1 | 17480029 | 0.510384 | 0.00238198 | 18.8208 | 17480030 | -0.000556745 | 0.513323 | 18.8497 |
| 2 | 17480024 | 0.507665 | 0.00510103 | 18.7085 | 17480023 | 0.00254063 | 0.510225 | 18.7171 |
| 3 | 17480016 | 0.507386 | 0.00537997 | 18.5615 | 17480018 | -0.000470050 | 0.513236 | 18.5849 |
| 4 | 17480017 | 0.508259 | 0.00450701 | 18.5008 | 17480015 | 0.00291720 | 0.509849 | 18.5768 |
| 5 | 17480032 | 0.511249 | 0.00151700 | 18.4742 | 17480031 | -0.000557742 | 0.513324 | 18.4461 |
| 6 | 17480021 | 0.509467 | 0.00329900 | 18.4028 | 17480022 | 0.00245270 | 0.510313 | 18.3881 |
| 7 | 17480025 | 0.508855 | 0.00391102 | 18.2843 | 17480026 | 0.00150156 | 0.511264 | 18.2919 |
| 8 | 17480020 | 0.510245 | 0.00252098 | 18.2351 | 17480011 | 0.00000 | 0.512766 | 18.2027 |
| 9 | 17480012 | 0.510932 | 0.00183398 | 18.1840 | 17480019 | 0.000258082 | 0.512508 | 18.1895 |
| 10 | 17480028 | 0.510382 | 0.00238401 | 18.1530 | 17480027 | 0.00152239 | 0.511244 | 18.1681 |
| 11 | 17480013 | 0.511747 | 0.00101900 | 17.9872 | 17480014 | 0.00401911 | 0.508747 | 18.0443 |