| Red | Green | Blue | |
| z | 17.64 | ||
| znorm | Inf | ||
| sky | -Inf | -NaN | -Inf |
| S/N | 18.1 | 33.7 | 38.8 |
| S/N(c) | 0.0 | 0.0 | 0.0 |
| SN(E/C) |
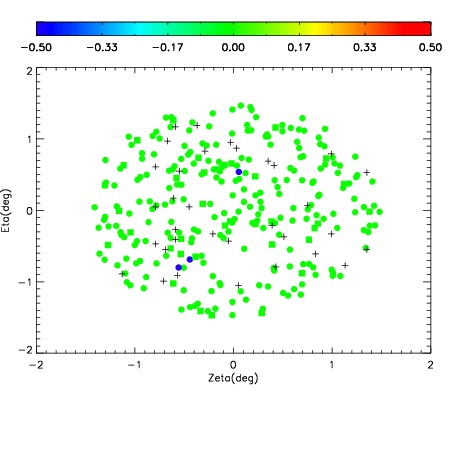
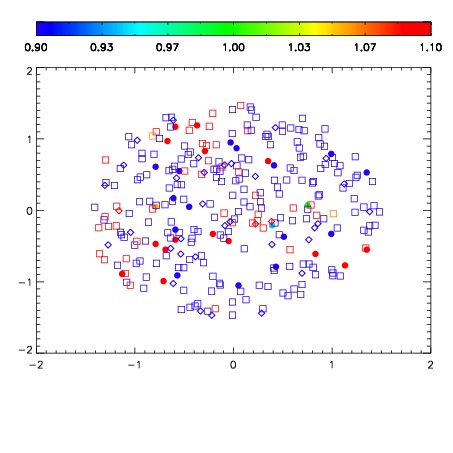


| Frame | Nreads | Zeropoints | Mag plots | Spatial mag deviation | Spatial sky 16325A emission deviations (filled: sky, open: star) | Spatial sky continuum emission | Spatial sky telluric CO2 absorption deviations (filled: H < 10) | |||||||||||||||||||||||
| 0 | 0 |
|
|
|
|
|
|
| IPAIR | NAME | SHIFT | NEWSHIFT | S/N | NAME | SHIFT | NEWSHIFT | S/N |
| 0 | 17440023 | 0.00149601 | 0.00000 | 18.0226 | 17440022 | -0.508312 | 0.509808 | 17.9771 |
| 1 | 17440028 | 0.000207480 | 0.00128853 | 18.2529 | 17440029 | -0.506518 | 0.508014 | 18.2581 |
| 2 | 17440020 | 0.00000 | 0.00149601 | 18.1528 | 17440026 | -0.507118 | 0.508614 | 18.2165 |
| 3 | 17440027 | -0.000317984 | 0.00181399 | 18.1089 | 17440021 | -0.507741 | 0.509237 | 18.1403 |
| 4 | 17440024 | 0.00145762 | 3.83900e-05 | 18.0574 | 17440025 | -0.506415 | 0.507911 | 18.0210 |
| 5 | 17440031 | -0.000674095 | 0.00217010 | 17.5649 | 17440030 | -0.507060 | 0.508556 | 17.7068 |