| Red | Green | Blue | |
| z | 17.64 | ||
| znorm | Inf | ||
| sky | -Inf | -NaN | -Inf |
| S/N | 13.4 | 24.7 | 28.6 |
| S/N(c) | 0.0 | 0.0 | 0.0 |
| SN(E/C) |
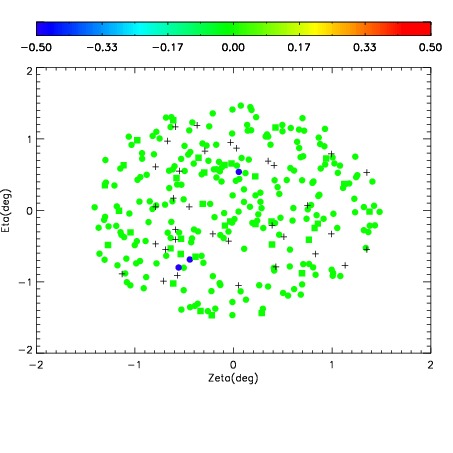
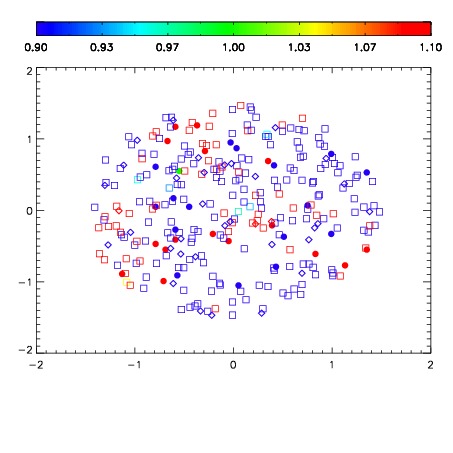


| Frame | Nreads | Zeropoints | Mag plots | Spatial mag deviation | Spatial sky 16325A emission deviations (filled: sky, open: star) | Spatial sky continuum emission | Spatial sky telluric CO2 absorption deviations (filled: H < 10) | |||||||||||||||||||||||
| 0 | 0 |
|
|
|
|
|
|
| IPAIR | NAME | SHIFT | NEWSHIFT | S/N | NAME | SHIFT | NEWSHIFT | S/N |
| 0 | 17450066 | 0.514527 | 0.00000 | 17.9074 | 17450065 | 0.00401858 | 0.510508 | 17.8778 |
| 1 | 17450062 | 0.513052 | 0.00147504 | 18.3414 | 17450061 | 0.00000 | 0.514527 | 18.2613 |
| 2 | 17450063 | 0.514324 | 0.000203013 | 18.2980 | 17450064 | 0.00338505 | 0.511142 | 18.1470 |