| Red | Green | Blue | |
| z | 17.64 | ||
| znorm | Inf | ||
| sky | -Inf | -NaN | -NaN |
| S/N | 24.1 | 42.0 | 49.1 |
| S/N(c) | 0.0 | 0.0 | 0.0 |
| SN(E/C) |
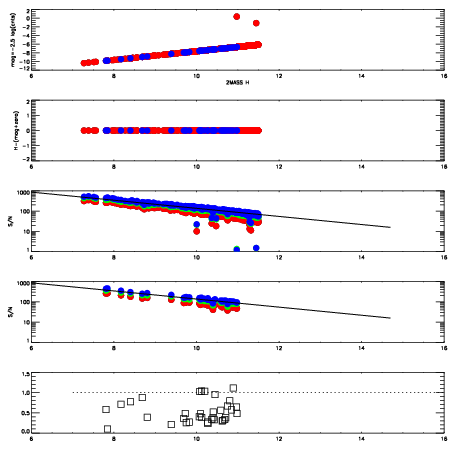
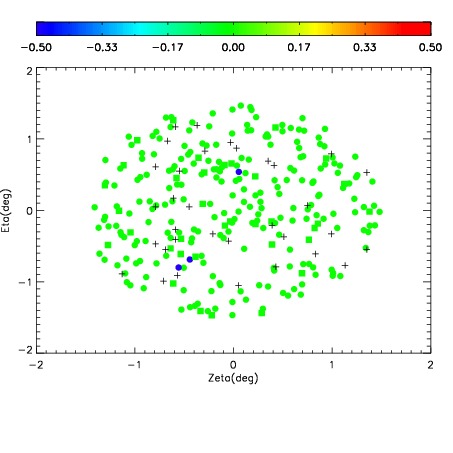
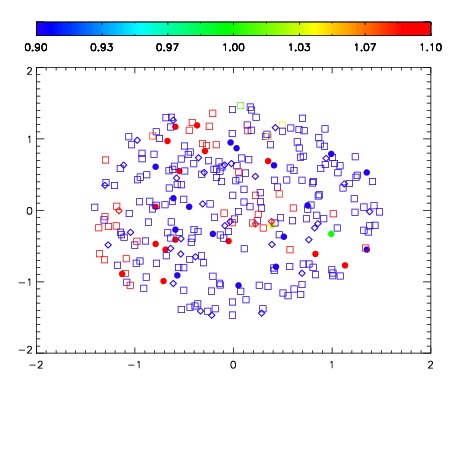


| Frame | Nreads | Zeropoints | Mag plots | Spatial mag deviation | Spatial sky 16325A emission deviations (filled: sky, open: star) | Spatial sky continuum emission | Spatial sky telluric CO2 absorption deviations (filled: H < 10) | |||||||||||||||||||||||
| 0 | 0 |
|
|
|
|
|
|
| IPAIR | NAME | SHIFT | NEWSHIFT | S/N | NAME | SHIFT | NEWSHIFT | S/N |
| 0 | 17460025 | 0.00186018 | 0.00000 | 18.4383 | 17460026 | -0.510200 | 0.512060 | 18.4178 |
| 1 | 17460029 | 0.000958635 | 0.000901545 | 18.5885 | 17460030 | -0.511097 | 0.512957 | 18.6195 |
| 2 | 17460028 | 0.000190855 | 0.00166933 | 18.5110 | 17460023 | -0.510183 | 0.512043 | 18.5208 |
| 3 | 17460024 | 0.00180933 | 5.08501e-05 | 18.5044 | 17460027 | -0.510620 | 0.512480 | 18.4597 |
| 4 | 17460021 | 0.00000 | 0.00186018 | 18.3240 | 17460022 | -0.510805 | 0.512665 | 18.3421 |
| 5 | 17460032 | 0.00145322 | 0.000406960 | 18.1360 | 17460031 | -0.510594 | 0.512454 | 18.1209 |