| Red | Green | Blue | |
| z | 17.64 | ||
| znorm | Inf | ||
| sky | -NaN | -Inf | -Inf |
| S/N | 22.5 | 37.5 | 43.4 |
| S/N(c) | 0.0 | 0.0 | 0.0 |
| SN(E/C) |
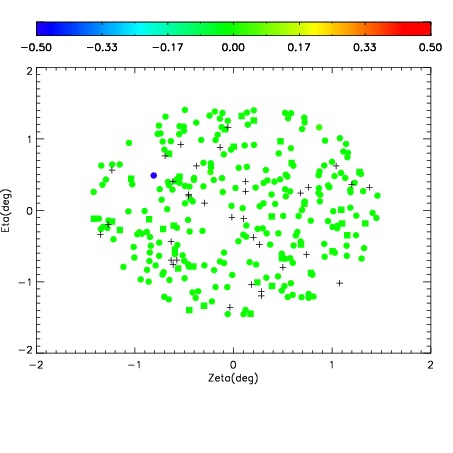
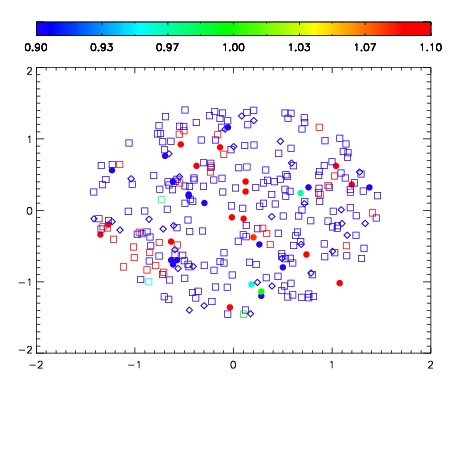
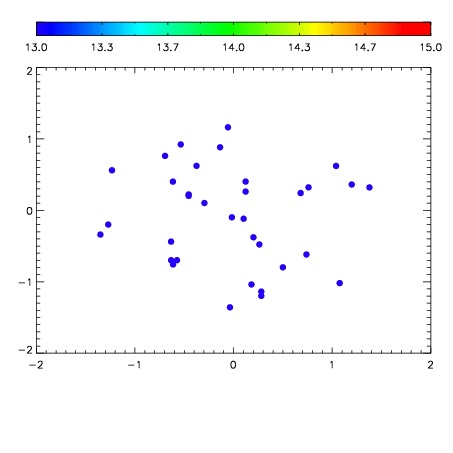

| Frame | Nreads | Zeropoints | Mag plots | Spatial mag deviation | Spatial sky 16325A emission deviations (filled: sky, open: star) | Spatial sky continuum emission | Spatial sky telluric CO2 absorption deviations (filled: H < 10) | |||||||||||||||||||||||
| 0 | 0 |
|
|
|
|
|
|
| IPAIR | NAME | SHIFT | NEWSHIFT | S/N | NAME | SHIFT | NEWSHIFT | S/N |
| 0 | 18660012 | 0.496783 | 0.00000 | 18.2669 | 18660017 | 0.00110964 | 0.495673 | 18.1649 |
| 1 | 18660011 | 0.495829 | 0.000954002 | 18.9629 | 18660010 | 0.00000 | 0.496783 | 19.0263 |
| 2 | 18660015 | 0.494619 | 0.00216398 | 18.5369 | 18660014 | -0.000109285 | 0.496892 | 18.3935 |
| 3 | 18660016 | 0.494614 | 0.00216898 | 18.3931 | 18660013 | 0.000254357 | 0.496529 | 18.1721 |