| Red | Green | Blue | |
| z | 17.64 | ||
| znorm | Inf | ||
| sky | -Inf | -Inf | -Inf |
| S/N | 22.4 | 37.2 | 43.5 |
| S/N(c) | 0.0 | 0.0 | 0.0 |
| SN(E/C) |
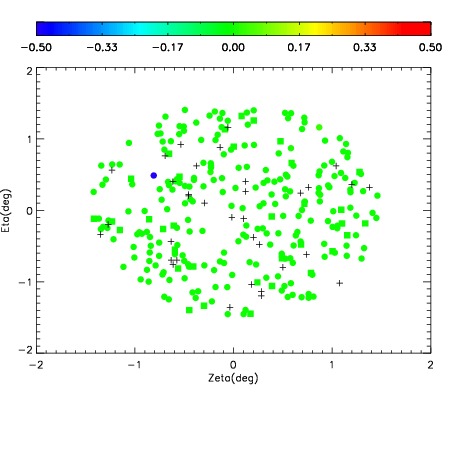
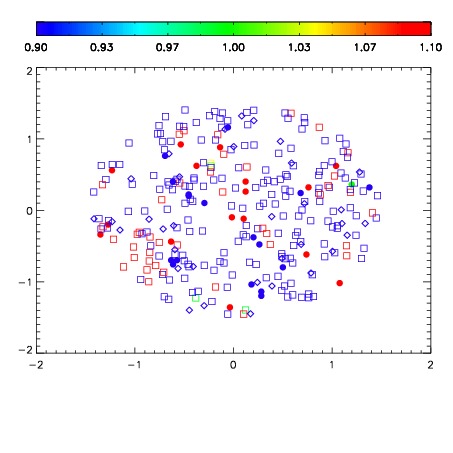
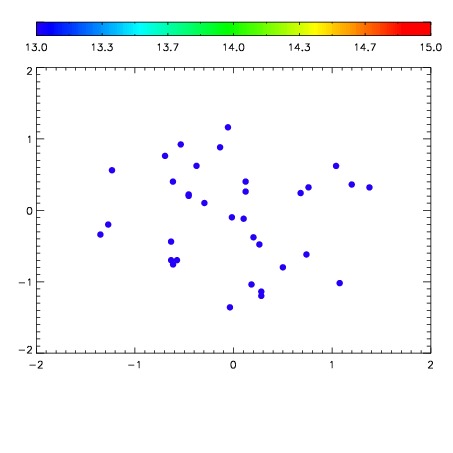

| Frame | Nreads | Zeropoints | Mag plots | Spatial mag deviation | Spatial sky 16325A emission deviations (filled: sky, open: star) | Spatial sky continuum emission | Spatial sky telluric CO2 absorption deviations (filled: H < 10) | |||||||||||||||||||||||
| 0 | 0 |
|
|
|
|
|
|
| IPAIR | NAME | SHIFT | NEWSHIFT | S/N | NAME | SHIFT | NEWSHIFT | S/N |
| 0 | 18670017 | 0.503379 | 0.00000 | 18.2865 | 18670018 | 0.00177033 | 0.501609 | 18.2614 |
| 1 | 18670012 | 0.502739 | 0.000639975 | 19.0358 | 18670011 | 0.00000 | 0.503379 | 19.0111 |
| 2 | 18670016 | 0.502772 | 0.000607014 | 18.4032 | 18670015 | 0.000596448 | 0.502783 | 18.3956 |
| 3 | 18670013 | 0.503263 | 0.000115991 | 18.2869 | 18670014 | 0.00136009 | 0.502019 | 18.2807 |