| Red | Green | Blue | |
| z | 17.64 | ||
| znorm | Inf | ||
| sky | -NaN | -Inf | -Inf |
| S/N | 21.0 | 35.3 | 41.9 |
| S/N(c) | 0.0 | 0.0 | 0.0 |
| SN(E/C) |
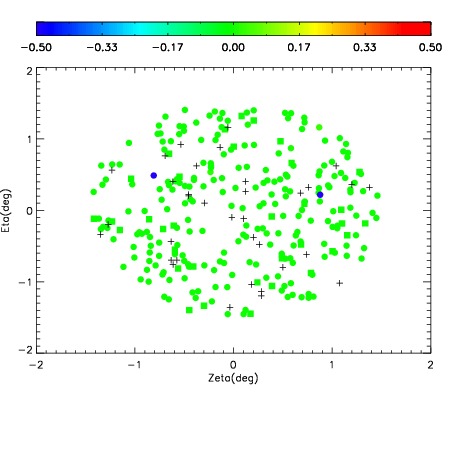
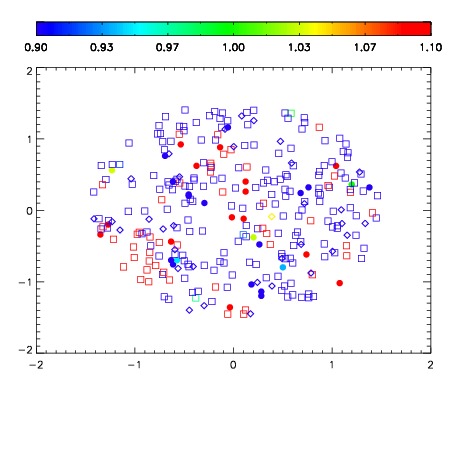
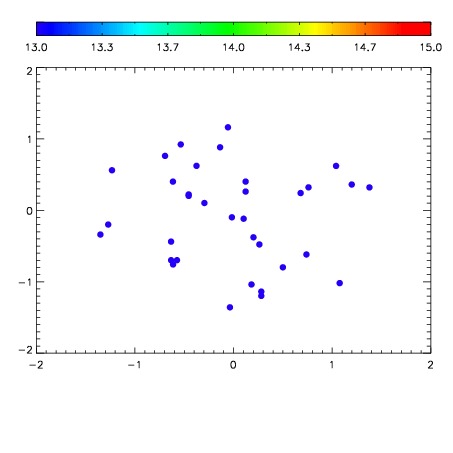

| Frame | Nreads | Zeropoints | Mag plots | Spatial mag deviation | Spatial sky 16325A emission deviations (filled: sky, open: star) | Spatial sky continuum emission | Spatial sky telluric CO2 absorption deviations (filled: H < 10) | |||||||||||||||||||||||
| 0 | 0 |
|
|
|
|
|
|
| IPAIR | NAME | SHIFT | NEWSHIFT | S/N | NAME | SHIFT | NEWSHIFT | S/N |
| 0 | 18680017 | 0.508435 | 0.00000 | 18.1669 | 18680014 | 0.000308064 | 0.508127 | 18.2750 |
| 1 | 18680012 | 0.505489 | 0.00294602 | 18.9084 | 18680011 | 0.00000 | 0.508435 | 18.9410 |
| 2 | 18680016 | 0.507130 | 0.00130498 | 18.3023 | 18680015 | 0.000662008 | 0.507773 | 18.3678 |
| 3 | 18680013 | 0.506444 | 0.00199103 | 18.1120 | 18680018 | 0.000600993 | 0.507834 | 18.1742 |