| Red | Green | Blue | |
| z | 17.64 | ||
| znorm | Inf | ||
| sky | -Inf | -Inf | -Inf |
| S/N | 22.3 | 37.0 | 42.6 |
| S/N(c) | 0.0 | 0.0 | 0.0 |
| SN(E/C) |
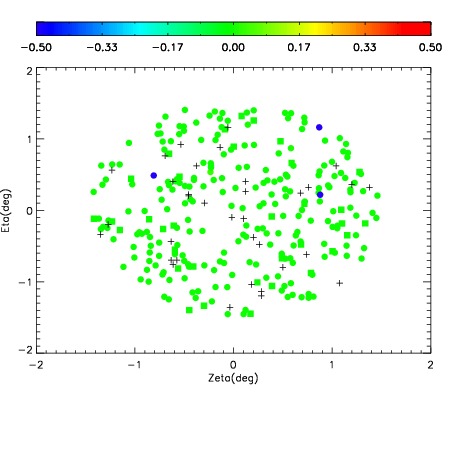
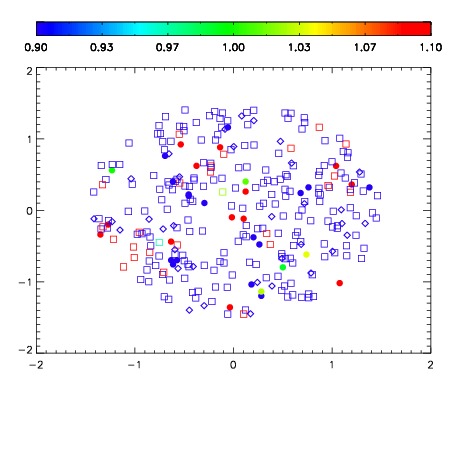
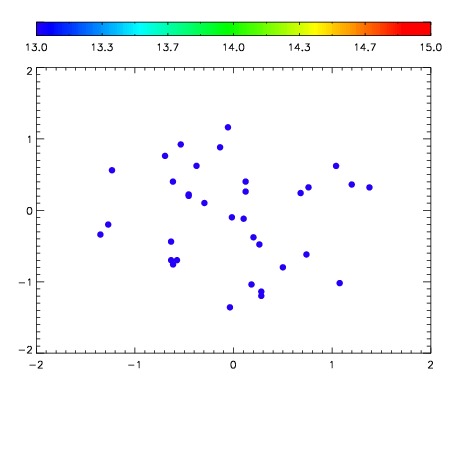

| Frame | Nreads | Zeropoints | Mag plots | Spatial mag deviation | Spatial sky 16325A emission deviations (filled: sky, open: star) | Spatial sky continuum emission | Spatial sky telluric CO2 absorption deviations (filled: H < 10) | |||||||||||||||||||||||
| 0 | 0 |
|
|
|
|
|
|
| IPAIR | NAME | SHIFT | NEWSHIFT | S/N | NAME | SHIFT | NEWSHIFT | S/N |
| 0 | 18690012 | 0.506699 | 0.00000 | 18.9222 | 18690011 | 0.00000 | 0.506699 | 18.9410 |
| 1 | 18690016 | 0.505489 | 0.00121003 | 18.4902 | 18690015 | 0.000213574 | 0.506485 | 18.4205 |
| 2 | 18690017 | 0.505913 | 0.000786006 | 18.3437 | 18690014 | 3.54822e-05 | 0.506664 | 18.3081 |
| 3 | 18690013 | 0.506621 | 7.80225e-05 | 18.2647 | 18690018 | 0.00162632 | 0.505073 | 18.1130 |