| Red | Green | Blue | |
| z | 17.64 | ||
| znorm | Inf | ||
| sky | -Inf | -Inf | -Inf |
| S/N | 18.8 | 32.0 | 38.0 |
| S/N(c) | 0.0 | 0.0 | 0.0 |
| SN(E/C) |
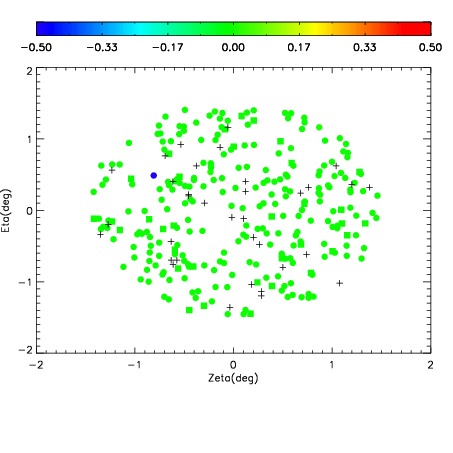
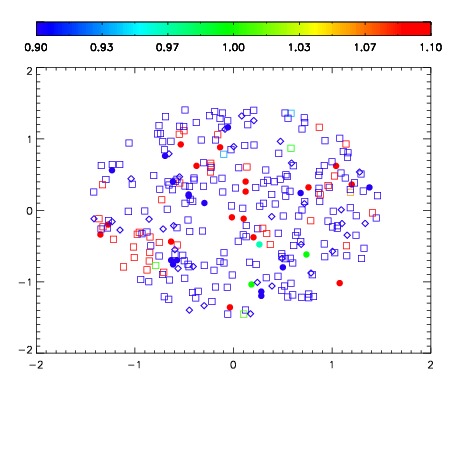


| Frame | Nreads | Zeropoints | Mag plots | Spatial mag deviation | Spatial sky 16325A emission deviations (filled: sky, open: star) | Spatial sky continuum emission | Spatial sky telluric CO2 absorption deviations (filled: H < 10) | |||||||||||||||||||||||
| 0 | 0 |
|
|
|
|
|
|
| IPAIR | NAME | SHIFT | NEWSHIFT | S/N | NAME | SHIFT | NEWSHIFT | S/N |
| 0 | 18700013 | 0.506540 | 0.00000 | 17.7855 | 18700018 | -0.00164987 | 0.508190 | 17.8961 |
| 1 | 18700012 | 0.504275 | 0.00226498 | 18.8067 | 18700011 | 0.00000 | 0.506540 | 18.9150 |
| 2 | 18700016 | 0.505102 | 0.00143802 | 18.3298 | 18700015 | -0.00140966 | 0.507950 | 18.1867 |
| 3 | 18700017 | 0.504873 | 0.00166702 | 18.0678 | 18700014 | -0.000706861 | 0.507247 | 18.0365 |