| Red | Green | Blue | |
| z | 17.64 | ||
| znorm | Inf | ||
| sky | -Inf | -Inf | -Inf |
| S/N | 21.2 | 42.8 | 46.9 |
| S/N(c) | 0.0 | 0.0 | 0.0 |
| SN(E/C) |
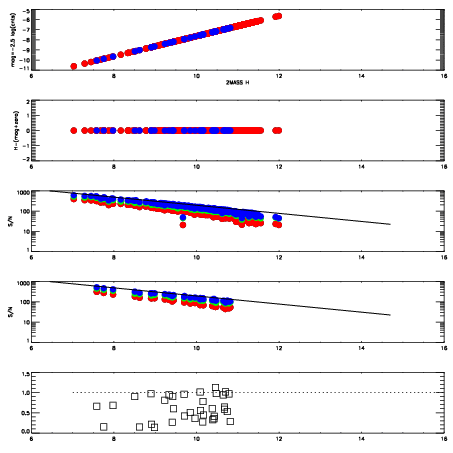
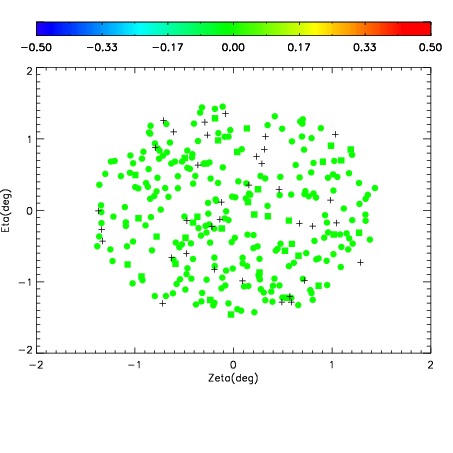
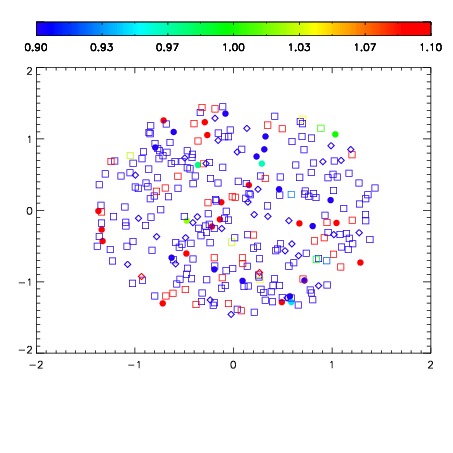
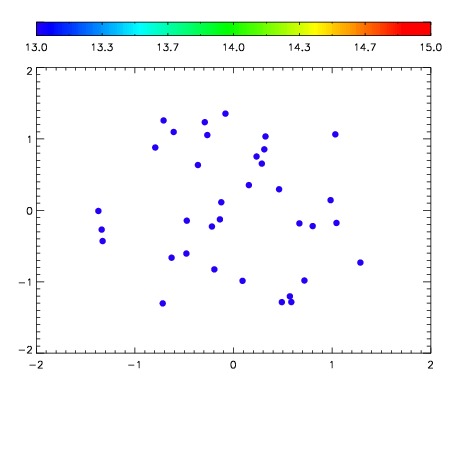

| Frame | Nreads | Zeropoints | Mag plots | Spatial mag deviation | Spatial sky 16325A emission deviations (filled: sky, open: star) | Spatial sky continuum emission | Spatial sky telluric CO2 absorption deviations (filled: H < 10) | |||||||||||||||||||||||
| 0 | 0 |
|
|
|
|
|
|
| IPAIR | NAME | SHIFT | NEWSHIFT | S/N | NAME | SHIFT | NEWSHIFT | S/N |
| 0 | 18640031 | 0.504833 | 0.00000 | 17.6415 | 18640025 | -0.000249515 | 0.505082 | 17.6929 |
| 1 | 18640027 | 0.500848 | 0.00398499 | 18.1248 | 18640033 | -0.00129975 | 0.506133 | 18.1071 |
| 2 | 18640032 | 0.504371 | 0.000461996 | 17.9309 | 18640041 | -0.00123725 | 0.506070 | 18.0854 |
| 3 | 18640035 | 0.501811 | 0.00302196 | 17.9186 | 18640026 | -0.00133104 | 0.506164 | 17.9993 |
| 4 | 18640036 | 0.502963 | 0.00186998 | 17.9103 | 18640034 | -0.000827355 | 0.505660 | 17.9683 |
| 5 | 18640039 | 0.501647 | 0.00318599 | 17.8636 | 18640037 | -0.000657741 | 0.505491 | 17.9556 |
| 6 | 18640043 | 0.503413 | 0.00141996 | 17.8596 | 18640038 | -0.00133048 | 0.506163 | 17.8326 |
| 7 | 18640040 | 0.502162 | 0.00267100 | 17.8436 | 18640042 | -0.00114101 | 0.505974 | 17.8212 |
| 8 | 18640024 | 0.502635 | 0.00219798 | 17.6179 | 18640045 | 2.85201e-05 | 0.504804 | 17.5865 |
| 9 | 18640044 | 0.504212 | 0.000620961 | 17.5342 | 18640030 | -0.00128865 | 0.506122 | 17.5686 |
| 10 | 18640023 | 0.502074 | 0.00275898 | 17.3238 | 18640029 | -0.000948989 | 0.505782 | 17.2117 |
| 11 | 18640028 | 0.502600 | 0.00223297 | 17.3060 | 18640022 | 0.00000 | 0.504833 | 17.1275 |