| Red | Green | Blue | |
| z | 17.64 | ||
| znorm | Inf | ||
| sky | -Inf | -Inf | -Inf |
| S/N | 20.9 | 39.4 | 43.9 |
| S/N(c) | 0.0 | 0.0 | 0.0 |
| SN(E/C) |
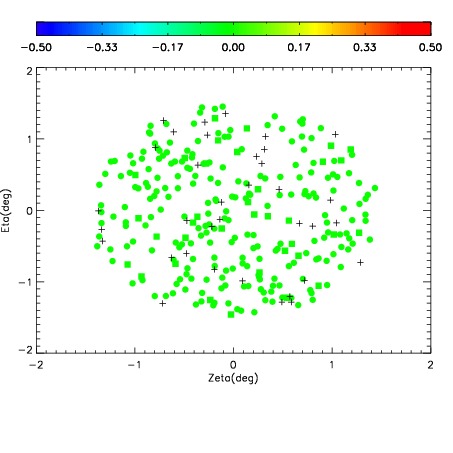
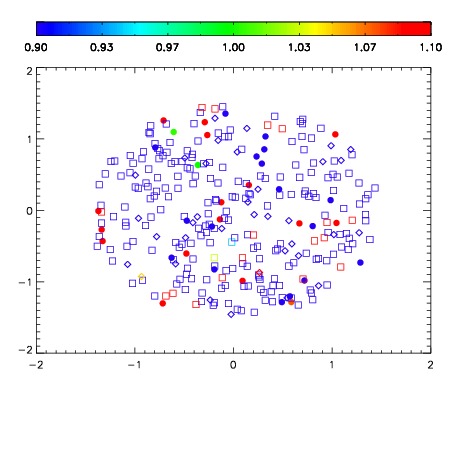


| Frame | Nreads | Zeropoints | Mag plots | Spatial mag deviation | Spatial sky 16325A emission deviations (filled: sky, open: star) | Spatial sky continuum emission | Spatial sky telluric CO2 absorption deviations (filled: H < 10) | |||||||||||||||||||||||
| 0 | 0 |
|
|
|
|
|
|
| IPAIR | NAME | SHIFT | NEWSHIFT | S/N | NAME | SHIFT | NEWSHIFT | S/N |
| 0 | 18650020 | 0.00000 | 0.00000 | 17.4936 | 18650021 | -0.502821 | 0.502821 | 17.5527 |
| 1 | 18650024 | -0.00545283 | 0.00545283 | 18.7011 | 18650025 | -0.501886 | 0.501886 | 18.6419 |
| 2 | 18650031 | -0.00544122 | 0.00544122 | 18.5950 | 18650030 | -0.502970 | 0.502970 | 18.6382 |
| 3 | 18650028 | -0.00297014 | 0.00297014 | 18.0668 | 18650029 | -0.501687 | 0.501687 | 18.0350 |
| 4 | 18650023 | -0.00403388 | 0.00403388 | 17.9648 | 18650026 | -0.502086 | 0.502086 | 17.9174 |
| 5 | 18650027 | -0.00328759 | 0.00328759 | 17.9570 | 18650022 | -0.503687 | 0.503687 | 17.9015 |