| Red | Green | Blue | |
| z | 17.64 | ||
| znorm | Inf | ||
| sky | -Inf | -Inf | -NaN |
| S/N | 13.8 | 24.1 | 25.4 |
| S/N(c) | 0.0 | 0.0 | 0.0 |
| SN(E/C) |
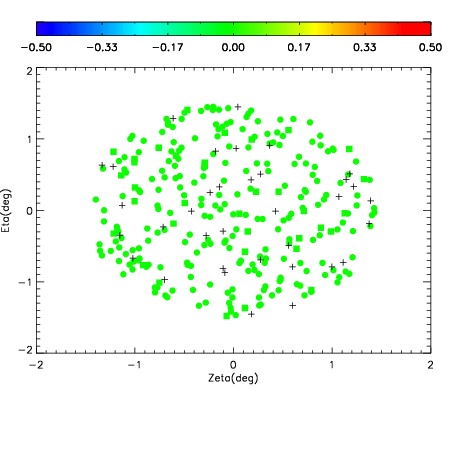
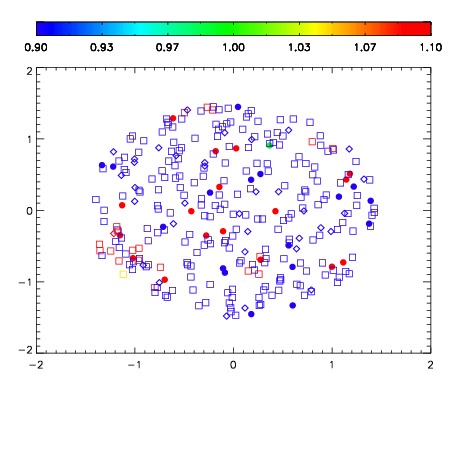
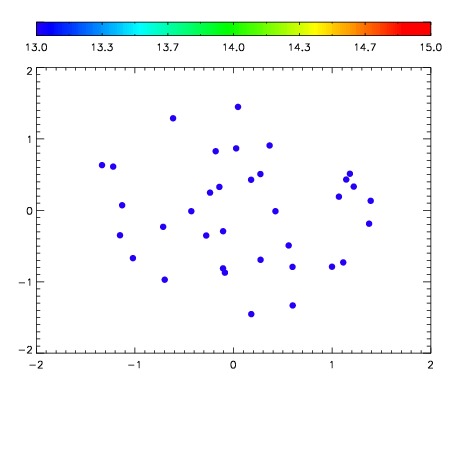

| Frame | Nreads | Zeropoints | Mag plots | Spatial mag deviation | Spatial sky 16325A emission deviations (filled: sky, open: star) | Spatial sky continuum emission | Spatial sky telluric CO2 absorption deviations (filled: H < 10) | |||||||||||||||||||||||
| 0 | 0 |
|
|
|
|
|
|
| IPAIR | NAME | SHIFT | NEWSHIFT | S/N | NAME | SHIFT | NEWSHIFT | S/N |
| 0 | 18670047 | 0.00108330 | 0.00000 | 18.2846 | 18670048 | -0.500397 | 0.501480 | 18.2404 |
| 1 | 18670043 | 0.00000 | 0.00108330 | 18.5347 | 18670044 | -0.501296 | 0.502379 | 18.5432 |
| 2 | 18670046 | 0.000383098 | 0.000700202 | 18.5242 | 18670045 | -0.501515 | 0.502598 | 18.4974 |