| Red | Green | Blue | |
| z | 17.64 | ||
| znorm | Inf | ||
| sky | -Inf | -Inf | -NaN |
| S/N | 10.4 | 18.9 | 19.8 |
| S/N(c) | 0.0 | 0.0 | 0.0 |
| SN(E/C) |
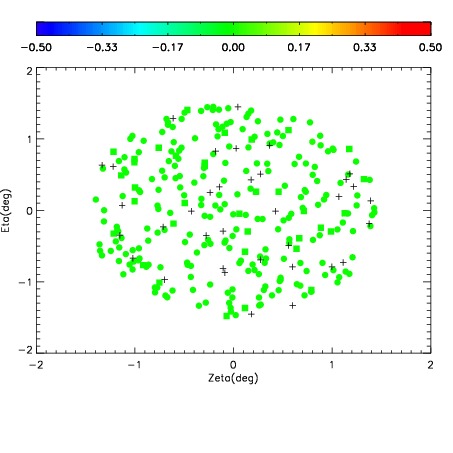
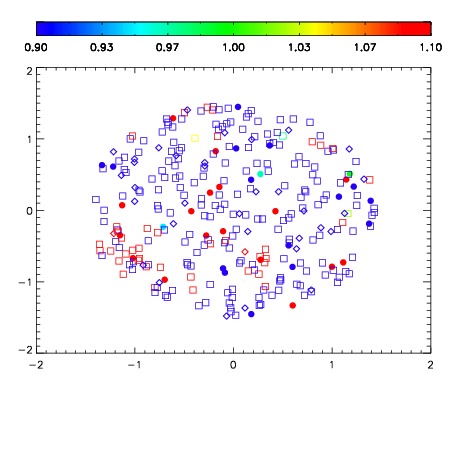
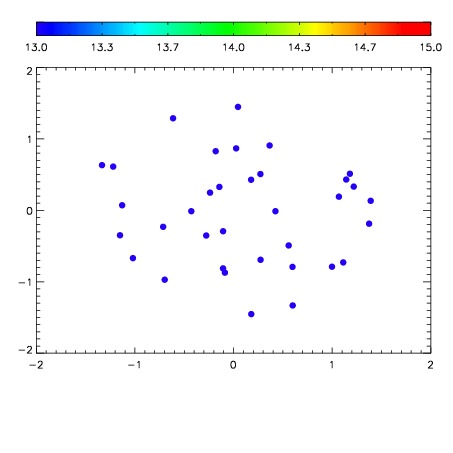

| Frame | Nreads | Zeropoints | Mag plots | Spatial mag deviation | Spatial sky 16325A emission deviations (filled: sky, open: star) | Spatial sky continuum emission | Spatial sky telluric CO2 absorption deviations (filled: H < 10) | |||||||||||||||||||||||
| 0 | 0 |
|
|
|
|
|
|
| IPAIR | NAME | SHIFT | NEWSHIFT | S/N | NAME | SHIFT | NEWSHIFT | S/N |
| 0 | 18700046 | 0.00449787 | 0.00000 | 18.1157 | 18700045 | -0.502868 | 0.507366 | 18.2575 |
| 1 | 18700043 | 0.00000 | 0.00449787 | 18.2954 | 18700044 | -0.503102 | 0.507600 | 18.2771 |
| 2 | 18700047 | 0.00441654 | 8.13301e-05 | 17.8868 | 18700048 | -0.502272 | 0.506770 | 17.9590 |