| Red | Green | Blue | |
| z | 17.64 | ||
| znorm | Inf | ||
| sky | -Inf | -Inf | -NaN |
| S/N | 34.9 | 61.8 | 68.1 |
| S/N(c) | 0.0 | 0.0 | 0.0 |
| SN(E/C) |
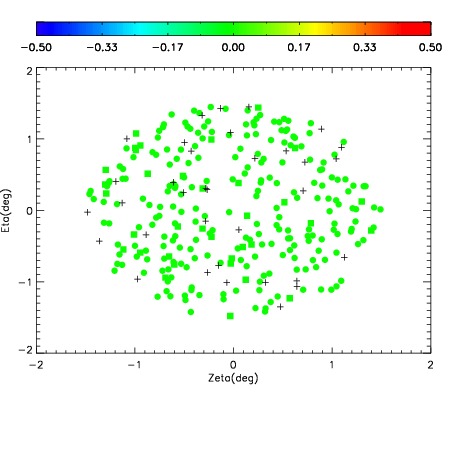
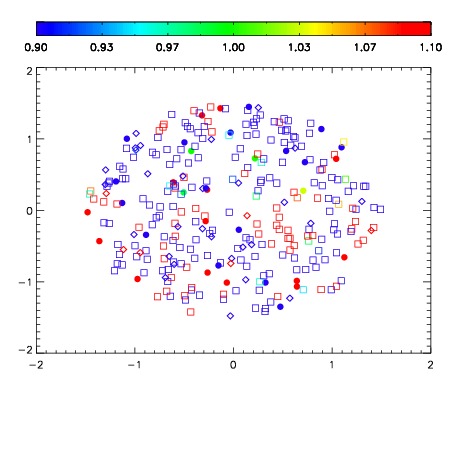
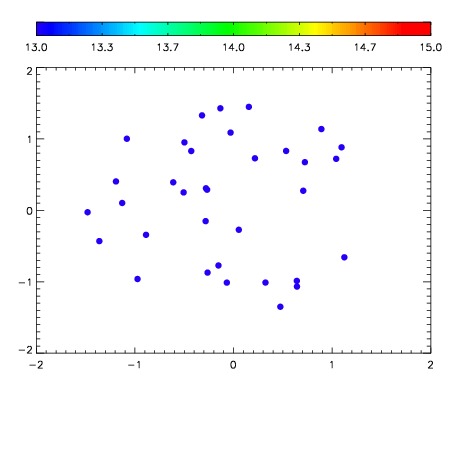

| Frame | Nreads | Zeropoints | Mag plots | Spatial mag deviation | Spatial sky 16325A emission deviations (filled: sky, open: star) | Spatial sky continuum emission | Spatial sky telluric CO2 absorption deviations (filled: H < 10) | |||||||||||||||||||||||
| 0 | 0 |
|
|
|
|
|
|
| IPAIR | NAME | SHIFT | NEWSHIFT | S/N | NAME | SHIFT | NEWSHIFT | S/N |
| 0 | 15300013 | 0.504155 | 0.00000 | 18.0410 | 15300014 | -0.00182313 | 0.505978 | 18.0031 |
| 1 | 15300016 | 0.501936 | 0.00221896 | 18.7654 | 15300015 | -0.00300040 | 0.507155 | 18.7898 |
| 2 | 15300029 | 0.501550 | 0.00260496 | 18.7415 | 15300030 | -0.00391829 | 0.508073 | 18.6429 |
| 3 | 15300024 | 0.502846 | 0.00130898 | 18.5621 | 15300023 | -0.00304245 | 0.507197 | 18.6131 |
| 4 | 15300021 | 0.503272 | 0.000882983 | 18.5063 | 15300022 | -0.00284718 | 0.507002 | 18.5664 |
| 5 | 15300017 | 0.503924 | 0.000230968 | 18.3781 | 15300018 | -0.00192417 | 0.506079 | 18.3741 |
| 6 | 15300032 | 0.501834 | 0.00232100 | 18.3486 | 15300031 | -0.00394370 | 0.508099 | 18.3511 |
| 7 | 15300028 | 0.501301 | 0.00285399 | 18.2752 | 15300027 | -0.00430198 | 0.508457 | 18.3485 |
| 8 | 15300012 | 0.503555 | 0.000599980 | 18.2421 | 15300026 | -0.00385108 | 0.508006 | 18.2703 |
| 9 | 15300025 | 0.504051 | 0.000103951 | 18.2213 | 15300019 | -0.00214013 | 0.506295 | 18.2230 |
| 10 | 15300020 | 0.503452 | 0.000702977 | 18.2141 | 15300011 | 0.00000 | 0.504155 | 18.1588 |
| 11 | 15300033 | 0.502675 | 0.00147998 | 18.0853 | 15300034 | -0.00325506 | 0.507410 | 18.0412 |