| Red | Green | Blue | |
| z | 17.64 | ||
| znorm | Inf | ||
| sky | -Inf | -Inf | -Inf |
| S/N | 26.4 | 53.2 | 52.7 |
| S/N(c) | 0.0 | 0.0 | 0.0 |
| SN(E/C) |
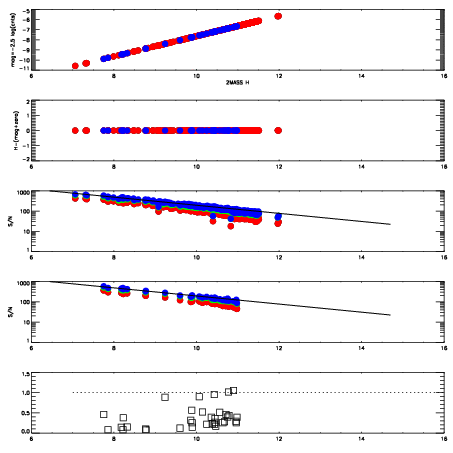
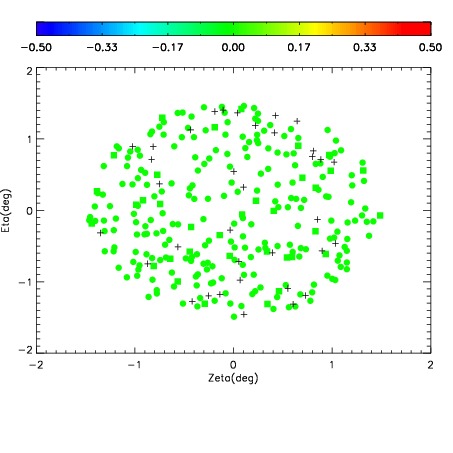
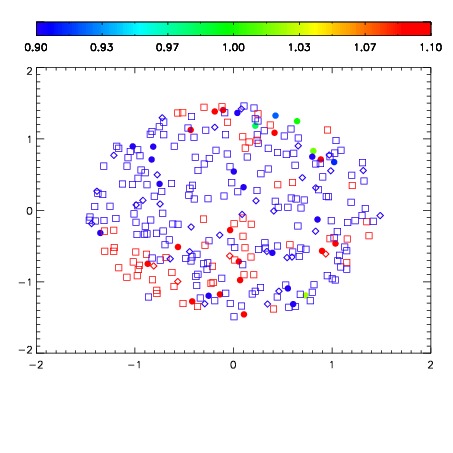
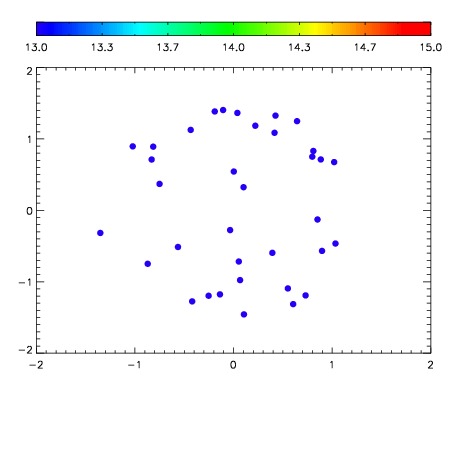

| Frame | Nreads | Zeropoints | Mag plots | Spatial mag deviation | Spatial sky 16325A emission deviations (filled: sky, open: star) | Spatial sky continuum emission | Spatial sky telluric CO2 absorption deviations (filled: H < 10) | |||||||||||||||||||||||
| 0 | 0 |
|
|
|
|
|
|
| IPAIR | NAME | SHIFT | NEWSHIFT | S/N | NAME | SHIFT | NEWSHIFT | S/N |
| 0 | 14840033 | 0.502271 | 0.00000 | 17.4924 | 14840034 | 0.00707598 | 0.495195 | 17.5745 |
| 1 | 14840032 | 0.501023 | 0.00124800 | 18.4440 | 14840031 | 0.00469708 | 0.497574 | 18.4673 |
| 2 | 14840029 | 0.500017 | 0.00225401 | 18.4001 | 14840018 | -0.000133184 | 0.502404 | 18.4167 |
| 3 | 14840017 | 0.497621 | 0.00465000 | 18.3914 | 14840030 | 0.00378847 | 0.498483 | 18.3550 |
| 4 | 14840024 | 0.497633 | 0.00463799 | 18.3189 | 14840011 | 0.00000 | 0.502271 | 18.3061 |
| 5 | 14840020 | 0.496815 | 0.00545600 | 18.2781 | 14840023 | 0.00159788 | 0.500673 | 18.2545 |
| 6 | 14840025 | 0.498675 | 0.00359601 | 18.2767 | 14840026 | 0.00152556 | 0.500745 | 18.2393 |
| 7 | 14840012 | 0.497919 | 0.00435200 | 18.2696 | 14840019 | -4.22692e-06 | 0.502275 | 18.2010 |
| 8 | 14840016 | 0.497232 | 0.00503901 | 18.1540 | 14840015 | 0.000119553 | 0.502151 | 18.1647 |
| 9 | 14840013 | 0.498424 | 0.00384700 | 18.0772 | 14840014 | -9.30715e-05 | 0.502364 | 18.0839 |
| 10 | 14840021 | 0.497695 | 0.00457600 | 17.9069 | 14840022 | 0.00120488 | 0.501066 | 17.7980 |
| 11 | 14840028 | 0.499693 | 0.00257799 | 17.6858 | 14840027 | 0.00150434 | 0.500767 | 17.7702 |