| Red | Green | Blue | |
| z | 17.64 | ||
| znorm | Inf | ||
| sky | -Inf | -Inf | -NaN |
| S/N | 14.9 | 28.4 | 28.2 |
| S/N(c) | 0.0 | 0.0 | 0.0 |
| SN(E/C) |

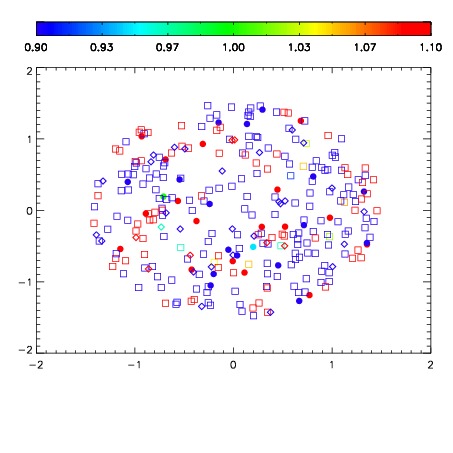


| Frame | Nreads | Zeropoints | Mag plots | Spatial mag deviation | Spatial sky 16325A emission deviations (filled: sky, open: star) | Spatial sky continuum emission | Spatial sky telluric CO2 absorption deviations (filled: H < 10) | |||||||||||||||||||||||
| 0 | 0 |
|
|
|
|
|
|
| IPAIR | NAME | SHIFT | NEWSHIFT | S/N | NAME | SHIFT | NEWSHIFT | S/N |
| 0 | 14510013 | 0.501693 | 0.00000 | 15.5928 | 14510015 | 0.000633058 | 0.501060 | 15.7875 |
| 1 | 14510021 | 0.499879 | 0.00181401 | 18.1741 | 14510018 | -0.00160483 | 0.503298 | 18.2348 |
| 2 | 14510020 | 0.499204 | 0.00248900 | 18.0374 | 14510022 | -0.000626028 | 0.502319 | 18.0844 |
| 3 | 14510017 | 0.499145 | 0.00254801 | 18.0086 | 14510019 | -0.00166557 | 0.503359 | 18.0828 |
| 4 | 14510016 | 0.498543 | 0.00315002 | 17.7638 | 14510014 | -7.67388e-05 | 0.501770 | 16.6427 |
| 5 | 14510012 | 0.500183 | 0.00151002 | 16.2144 | 14510011 | 0.00000 | 0.501693 | 15.8141 |