| Red | Green | Blue | |
| z | 17.64 | ||
| znorm | Inf | ||
| sky | -Inf | -Inf | -Inf |
| S/N | 22.1 | 43.0 | 42.8 |
| S/N(c) | 0.0 | 0.0 | 0.0 |
| SN(E/C) |
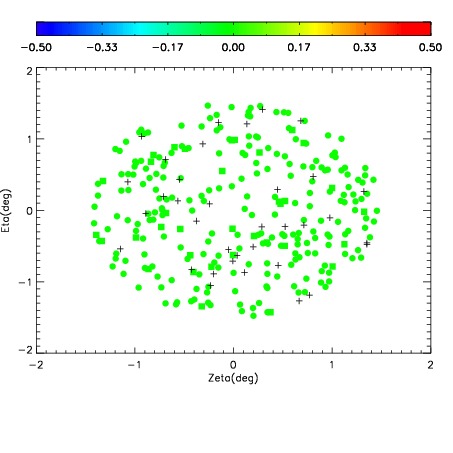
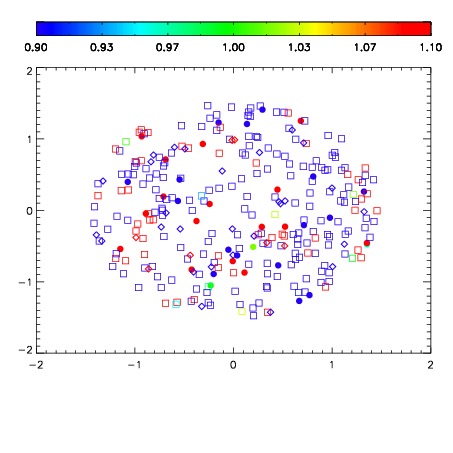


| Frame | Nreads | Zeropoints | Mag plots | Spatial mag deviation | Spatial sky 16325A emission deviations (filled: sky, open: star) | Spatial sky continuum emission | Spatial sky telluric CO2 absorption deviations (filled: H < 10) | |||||||||||||||||||||||
| 0 | 0 |
|
|
|
|
|
|
| IPAIR | NAME | SHIFT | NEWSHIFT | S/N | NAME | SHIFT | NEWSHIFT | S/N |
| 0 | 14530024 | 0.504572 | 0.00000 | 17.8172 | 14530013 | -0.00246938 | 0.507041 | 17.7916 |
| 1 | 14530020 | 0.503306 | 0.00126600 | 18.5662 | 14530021 | -0.000146170 | 0.504718 | 18.5892 |
| 2 | 14530015 | 0.499455 | 0.00511697 | 18.3381 | 14530022 | 0.00218604 | 0.502386 | 18.2675 |
| 3 | 14530023 | 0.502311 | 0.00226098 | 18.2232 | 14530014 | -0.00120766 | 0.505780 | 18.2070 |
| 4 | 14530011 | 0.499548 | 0.00502399 | 18.1858 | 14530010 | 0.00000 | 0.504572 | 18.0551 |
| 5 | 14530019 | 0.502394 | 0.00217795 | 17.9952 | 14530018 | -0.000251101 | 0.504823 | 17.9618 |
| 6 | 14530016 | 0.501947 | 0.00262499 | 17.8833 | 14530017 | 0.00126119 | 0.503311 | 17.8516 |
| 7 | 14530012 | 0.501232 | 0.00333995 | 17.8655 | 14530025 | 0.00376090 | 0.500811 | 17.7992 |