| Red | Green | Blue | |
| z | 17.64 | ||
| znorm | Inf | ||
| sky | -Inf | -Inf | -NaN |
| S/N | 18.0 | 33.3 | 33.4 |
| S/N(c) | 0.0 | 0.0 | 0.0 |
| SN(E/C) |


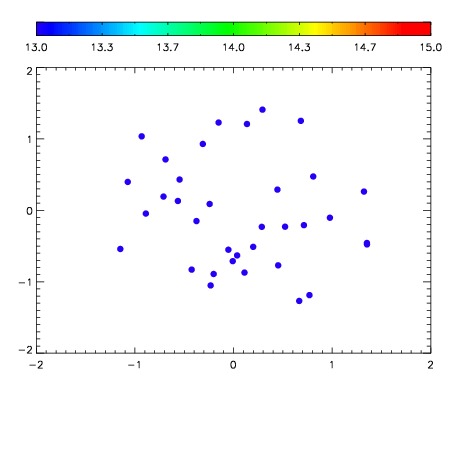

| Frame | Nreads | Zeropoints | Mag plots | Spatial mag deviation | Spatial sky 16325A emission deviations (filled: sky, open: star) | Spatial sky continuum emission | Spatial sky telluric CO2 absorption deviations (filled: H < 10) | |||||||||||||||||||||||
| 0 | 0 |
|
|
|
|
|
|
| IPAIR | NAME | SHIFT | NEWSHIFT | S/N | NAME | SHIFT | NEWSHIFT | S/N |
| 0 | 14580047 | 0.497573 | 0.00000 | 17.8363 | 14580046 | -0.000893576 | 0.498467 | 17.8176 |
| 1 | 14580043 | 0.495868 | 0.00170499 | 18.4312 | 14580049 | -0.00225733 | 0.499830 | 18.3279 |
| 2 | 14580048 | 0.497465 | 0.000107974 | 18.3804 | 14580045 | -0.00158155 | 0.499155 | 18.2571 |
| 3 | 14580044 | 0.496818 | 0.000754982 | 18.2023 | 14580042 | 0.00000 | 0.497573 | 18.0865 |