| Red | Green | Blue | |
| z | 17.64 | ||
| znorm | Inf | ||
| sky | -Inf | -NaN | -NaN |
| S/N | 29.3 | 54.3 | 56.7 |
| S/N(c) | 0.0 | 0.0 | 0.0 |
| SN(E/C) |
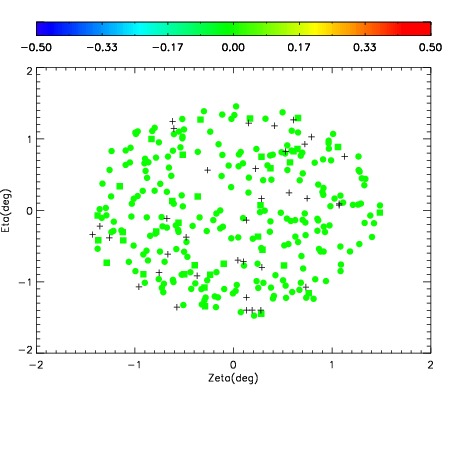
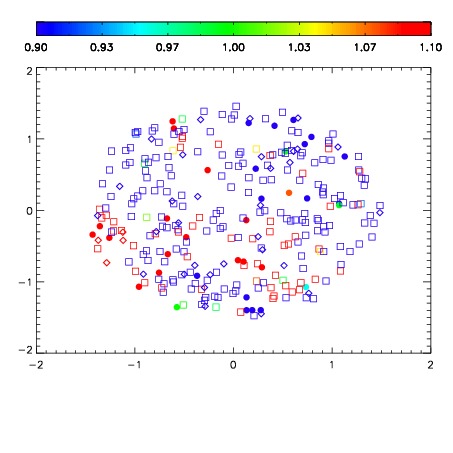


| Frame | Nreads | Zeropoints | Mag plots | Spatial mag deviation | Spatial sky 16325A emission deviations (filled: sky, open: star) | Spatial sky continuum emission | Spatial sky telluric CO2 absorption deviations (filled: H < 10) | |||||||||||||||||||||||
| 0 | 0 |
|
|
|
|
|
|
| IPAIR | NAME | SHIFT | NEWSHIFT | S/N | NAME | SHIFT | NEWSHIFT | S/N |
| 0 | 14780033 | 0.502847 | 0.00000 | 17.8553 | 14780034 | 0.00594128 | 0.496906 | 17.7526 |
| 1 | 14780016 | 0.496776 | 0.00607100 | 18.5971 | 14780015 | -0.000533062 | 0.503380 | 18.5197 |
| 2 | 14780029 | 0.501629 | 0.00121802 | 18.5146 | 14780030 | 0.00418509 | 0.498662 | 18.5111 |
| 3 | 14780024 | 0.499838 | 0.00300902 | 18.4801 | 14780023 | 0.00178392 | 0.501063 | 18.4921 |
| 4 | 14780021 | 0.498015 | 0.00483203 | 18.4187 | 14780022 | 0.00139333 | 0.501454 | 18.4049 |
| 5 | 14780017 | 0.497640 | 0.00520700 | 18.3789 | 14780031 | 0.00393518 | 0.498912 | 18.3926 |
| 6 | 14780032 | 0.501473 | 0.00137401 | 18.3501 | 14780018 | -0.000117971 | 0.502965 | 18.3578 |
| 7 | 14780012 | 0.497074 | 0.00577301 | 18.2404 | 14780026 | 0.00341356 | 0.499433 | 18.2449 |
| 8 | 14780020 | 0.498804 | 0.00404301 | 18.2141 | 14780011 | 0.00000 | 0.502847 | 18.2428 |
| 9 | 14780025 | 0.501617 | 0.00123000 | 18.1986 | 14780014 | -0.000417399 | 0.503264 | 18.2336 |
| 10 | 14780028 | 0.501612 | 0.00123501 | 18.0812 | 14780019 | 0.000847785 | 0.501999 | 18.2208 |
| 11 | 14780013 | 0.497699 | 0.00514802 | 18.0601 | 14780027 | 0.00334144 | 0.499506 | 18.1321 |