| Red | Green | Blue | |
| z | 17.64 | ||
| znorm | Inf | ||
| sky | -Inf | -NaN | -Inf |
| S/N | 13.7 | 24.7 | 25.5 |
| S/N(c) | 0.0 | 0.0 | 0.0 |
| SN(E/C) |

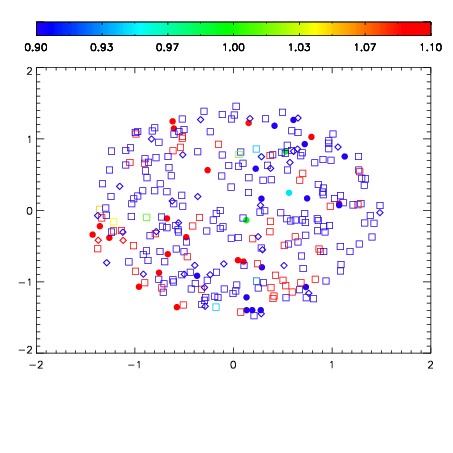


| Frame | Nreads | Zeropoints | Mag plots | Spatial mag deviation | Spatial sky 16325A emission deviations (filled: sky, open: star) | Spatial sky continuum emission | Spatial sky telluric CO2 absorption deviations (filled: H < 10) | |||||||||||||||||||||||
| 0 | 0 |
|
|
|
|
|
|
| IPAIR | NAME | SHIFT | NEWSHIFT | S/N | NAME | SHIFT | NEWSHIFT | S/N |
| 0 | 14790016 | 0.499331 | 0.00000 | 18.2956 | 14790015 | 0.000459954 | 0.498871 | 18.5213 |
| 1 | 14790012 | 0.498576 | 0.000755012 | 17.9414 | 14790014 | 0.00103802 | 0.498293 | 18.1239 |
| 2 | 14790013 | 0.499048 | 0.000283003 | 17.7077 | 14790011 | 0.00000 | 0.499331 | 18.1082 |