| Red | Green | Blue | |
| z | 17.64 | ||
| znorm | Inf | ||
| sky | -NaN | -Inf | -NaN |
| S/N | 31.8 | 57.9 | 58.9 |
| S/N(c) | 0.0 | 0.0 | 0.0 |
| SN(E/C) |
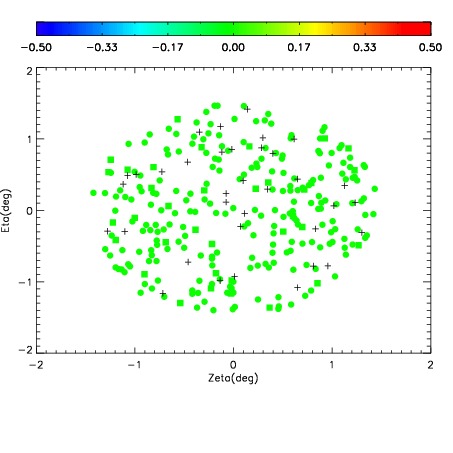
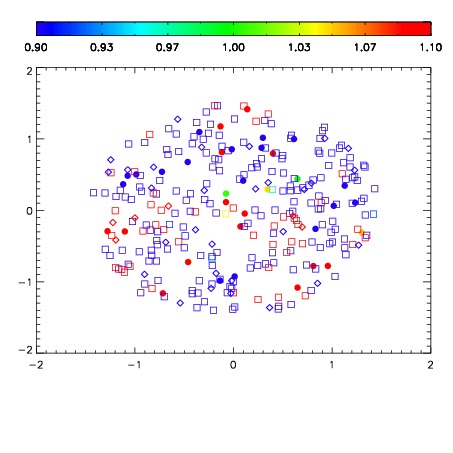
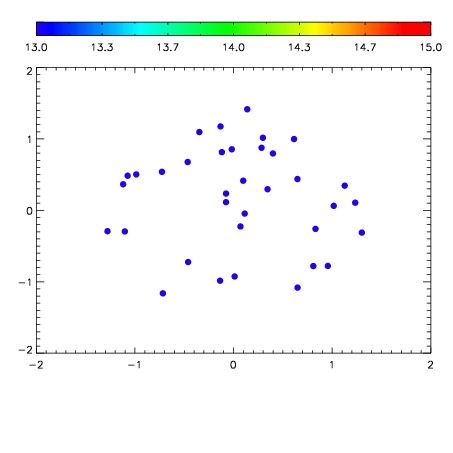

| Frame | Nreads | Zeropoints | Mag plots | Spatial mag deviation | Spatial sky 16325A emission deviations (filled: sky, open: star) | Spatial sky continuum emission | Spatial sky telluric CO2 absorption deviations (filled: H < 10) | |||||||||||||||||||||||
| 0 | 0 |
|
|
|
|
|
|
| IPAIR | NAME | SHIFT | NEWSHIFT | S/N | NAME | SHIFT | NEWSHIFT | S/N |
| 0 | 14270064 | 0.00144942 | 0.00000 | 17.7623 | 14270058 | -0.501212 | 0.502661 | 17.7406 |
| 1 | 14270060 | 0.000442658 | 0.00100676 | 18.8556 | 14270061 | -0.501503 | 0.502952 | 18.7754 |
| 2 | 14270067 | -0.00113858 | 0.00258800 | 18.8206 | 14270073 | -0.501182 | 0.502631 | 18.7313 |
| 3 | 14270072 | 0.000371931 | 0.00107749 | 18.7441 | 14270066 | -0.501536 | 0.502985 | 18.7189 |
| 4 | 14270075 | -0.000778040 | 0.00222746 | 18.5800 | 14270074 | -0.500945 | 0.502394 | 18.5909 |
| 5 | 14270079 | -0.00336640 | 0.00481582 | 18.5330 | 14270078 | -0.505004 | 0.506453 | 18.5092 |
| 6 | 14270068 | -0.000398845 | 0.00184827 | 18.3681 | 14270069 | -0.500979 | 0.502428 | 18.2723 |
| 7 | 14270076 | -4.27962e-05 | 0.00149222 | 18.1681 | 14270077 | -0.504539 | 0.505988 | 18.1299 |
| 8 | 14270063 | 0.000394245 | 0.00105517 | 17.9267 | 14270062 | -0.500654 | 0.502103 | 17.9941 |
| 9 | 14270071 | 0.000834051 | 0.000615369 | 17.9201 | 14270057 | -0.500843 | 0.502292 | 17.9150 |
| 10 | 14270056 | 0.00000 | 0.00144942 | 17.8781 | 14270065 | -0.500212 | 0.501661 | 17.8794 |
| 11 | 14270059 | 0.000716155 | 0.000733265 | 17.5676 | 14270070 | -0.501537 | 0.502986 | 17.7107 |