| Red | Green | Blue | |
| z | 17.64 | ||
| znorm | Inf | ||
| sky | -Inf | -NaN | -Inf |
| S/N | 32.7 | 60.6 | 60.5 |
| S/N(c) | 0.0 | 0.0 | 0.0 |
| SN(E/C) |


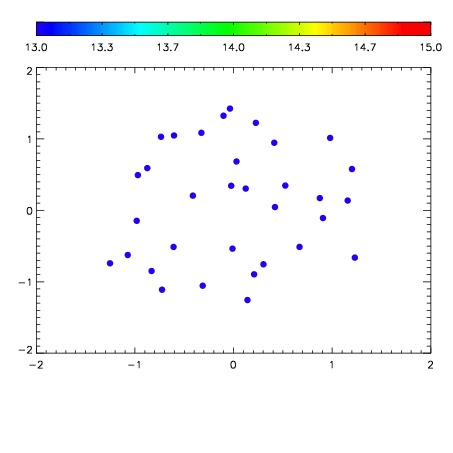

| Frame | Nreads | Zeropoints | Mag plots | Spatial mag deviation | Spatial sky 16325A emission deviations (filled: sky, open: star) | Spatial sky continuum emission | Spatial sky telluric CO2 absorption deviations (filled: H < 10) | |||||||||||||||||||||||
| 0 | 0 |
|
|
|
|
|
|
| IPAIR | NAME | SHIFT | NEWSHIFT | S/N | NAME | SHIFT | NEWSHIFT | S/N |
| 0 | 14800025 | 0.503380 | 0.00000 | 18.2164 | 14800026 | 0.00566802 | 0.497712 | 18.2549 |
| 1 | 14800029 | 0.501856 | 0.00152397 | 18.7031 | 14800015 | 0.00142330 | 0.501957 | 18.7287 |
| 2 | 14800016 | 0.497391 | 0.00598902 | 18.6836 | 14800030 | 0.00517877 | 0.498201 | 18.7019 |
| 3 | 14800024 | 0.500990 | 0.00239003 | 18.6485 | 14800023 | 0.00430141 | 0.499079 | 18.5924 |
| 4 | 14800017 | 0.498744 | 0.00463599 | 18.4324 | 14800022 | 0.00455741 | 0.498823 | 18.5602 |
| 5 | 14800021 | 0.502077 | 0.00130302 | 18.3085 | 14800027 | 0.00491736 | 0.498463 | 18.3844 |
| 6 | 14800032 | 0.502308 | 0.00107199 | 18.3074 | 14800018 | 0.00313316 | 0.500247 | 18.3540 |
| 7 | 14800028 | 0.501524 | 0.00185603 | 18.2968 | 14800031 | 0.00530526 | 0.498075 | 18.3078 |
| 8 | 14800012 | 0.497012 | 0.00636801 | 18.2311 | 14800011 | 0.00000 | 0.503380 | 18.3063 |
| 9 | 14800033 | 0.502563 | 0.000817001 | 18.0744 | 14800014 | 0.00199320 | 0.501387 | 18.0336 |
| 10 | 14800013 | 0.499177 | 0.00420299 | 18.0468 | 14800019 | 0.00408067 | 0.499299 | 18.0102 |
| 11 | 14800020 | 0.501657 | 0.00172299 | 18.0128 | 14800034 | 0.00545288 | 0.497927 | 17.8695 |