| Red | Green | Blue | |
| z | 17.64 | ||
| znorm | Inf | ||
| sky | -Inf | -NaN | -NaN |
| S/N | 12.4 | 24.3 | 24.1 |
| S/N(c) | 0.0 | 0.0 | 0.0 |
| SN(E/C) |
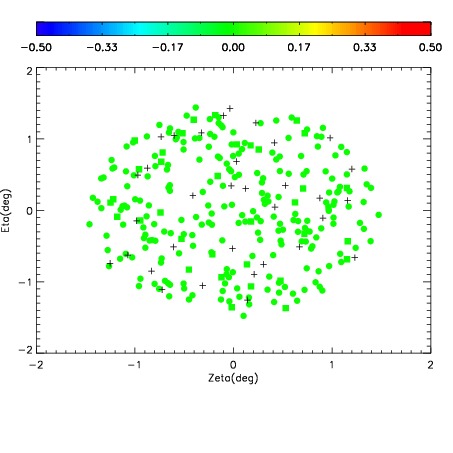
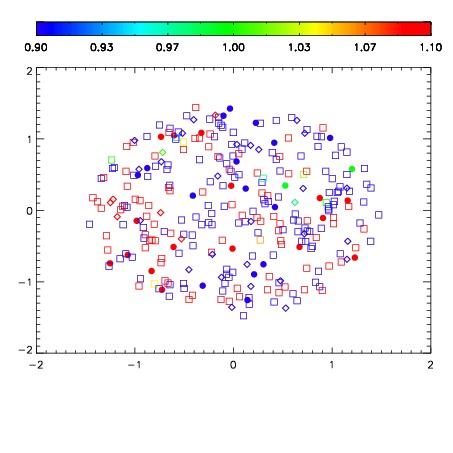


| Frame | Nreads | Zeropoints | Mag plots | Spatial mag deviation | Spatial sky 16325A emission deviations (filled: sky, open: star) | Spatial sky continuum emission | Spatial sky telluric CO2 absorption deviations (filled: H < 10) | |||||||||||||||||||||||
| 0 | 0 |
|
|
|
|
|
|
| IPAIR | NAME | SHIFT | NEWSHIFT | S/N | NAME | SHIFT | NEWSHIFT | S/N |
| 0 | 14810019 | 0.500792 | 0.00000 | 17.7845 | 14810020 | -2.87389e-05 | 0.500821 | 17.8203 |
| 1 | 14810022 | 0.500064 | 0.000728011 | 18.3018 | 14810021 | 1.47457e-05 | 0.500777 | 18.0640 |
| 2 | 14810018 | 0.498831 | 0.00196102 | 18.0105 | 14810017 | 0.00000 | 0.500792 | 17.9514 |