| Red | Green | Blue | |
| z | 17.64 | ||
| znorm | Inf | ||
| sky | -Inf | -Inf | -Inf |
| S/N | 15.7 | 29.4 | 32.8 |
| S/N(c) | 0.0 | 0.0 | 0.0 |
| SN(E/C) |
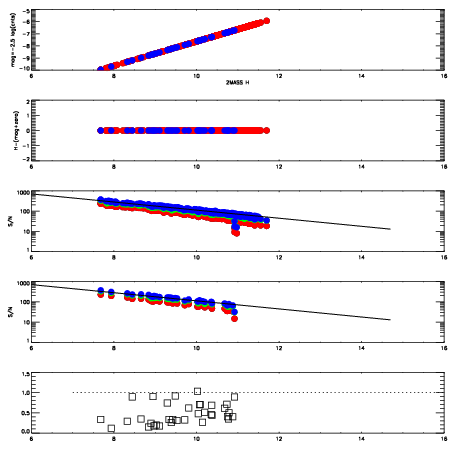
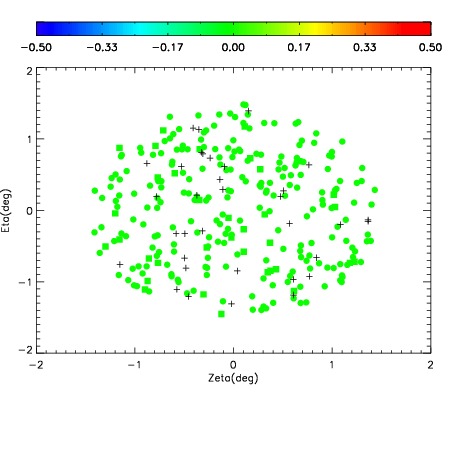
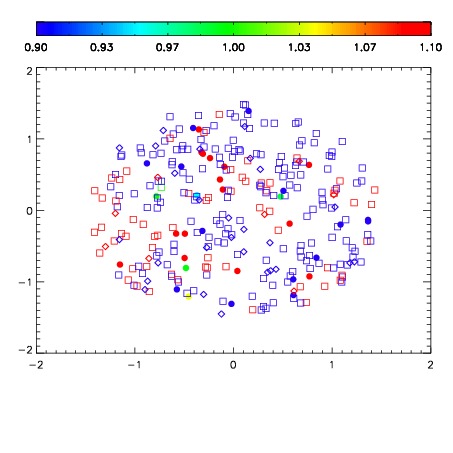
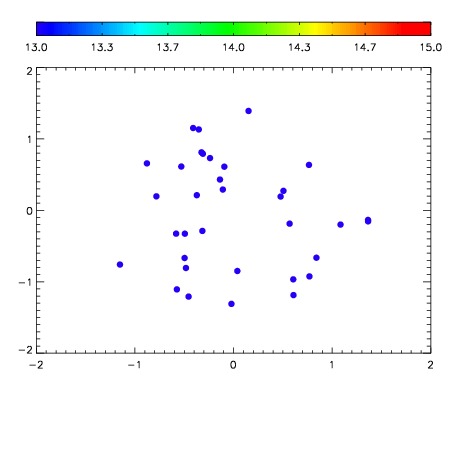

| Frame | Nreads | Zeropoints | Mag plots | Spatial mag deviation | Spatial sky 16325A emission deviations (filled: sky, open: star) | Spatial sky continuum emission | Spatial sky telluric CO2 absorption deviations (filled: H < 10) | |||||||||||||||||||||||
| 0 | 0 |
|
|
|
|
|
|
| IPAIR | NAME | SHIFT | NEWSHIFT | S/N | NAME | SHIFT | NEWSHIFT | S/N |
| 0 | 14500020 | 0.00137191 | 0.00000 | 17.3181 | 14500021 | -0.499543 | 0.500915 | 18.1727 |
| 1 | 14500016 | 0.00000 | 0.00137191 | 18.5394 | 14500017 | -0.500897 | 0.502269 | 18.6049 |
| 2 | 14500023 | 0.000814161 | 0.000557749 | 18.4359 | 14500022 | -0.498979 | 0.500351 | 18.5816 |
| 3 | 14500019 | 0.000791096 | 0.000580814 | 18.2730 | 14500018 | -0.500509 | 0.501881 | 18.3550 |