| Red | Green | Blue | |
| z | 17.64 | ||
| znorm | Inf | ||
| sky | -Inf | -Inf | -Inf |
| S/N | 16.9 | 32.9 | 37.0 |
| S/N(c) | 0.0 | 0.0 | 0.0 |
| SN(E/C) |
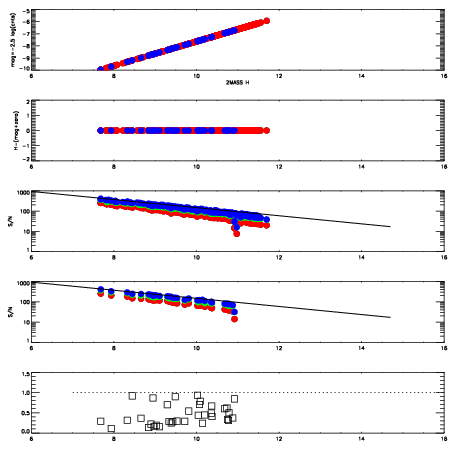
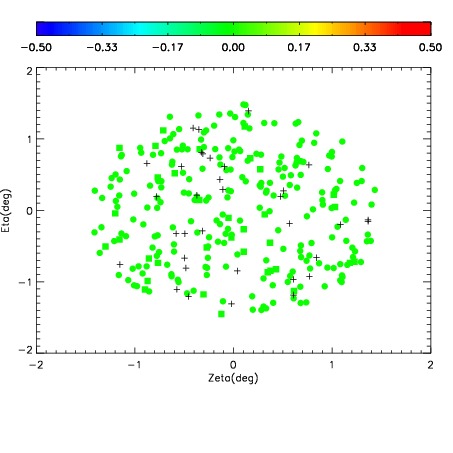
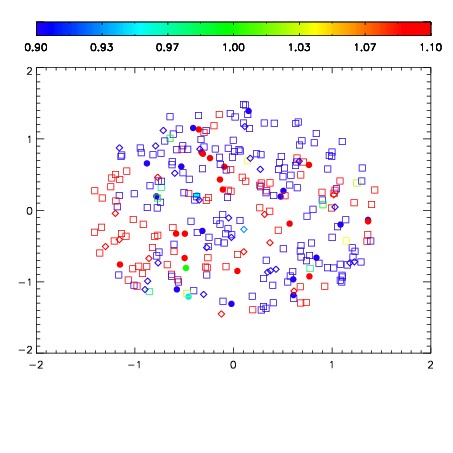
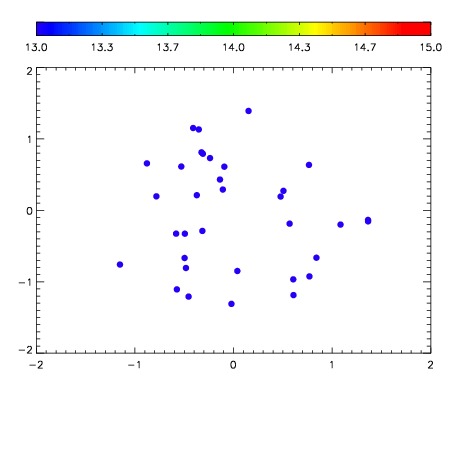

| Frame | Nreads | Zeropoints | Mag plots | Spatial mag deviation | Spatial sky 16325A emission deviations (filled: sky, open: star) | Spatial sky continuum emission | Spatial sky telluric CO2 absorption deviations (filled: H < 10) | |||||||||||||||||||||||
| 0 | 0 |
|
|
|
|
|
|
| IPAIR | NAME | SHIFT | NEWSHIFT | S/N | NAME | SHIFT | NEWSHIFT | S/N |
| 0 | 14510039 | 0.504424 | 0.00000 | 18.1985 | 14510029 | -0.00172716 | 0.506151 | 18.3727 |
| 1 | 14510028 | 0.499761 | 0.00466299 | 18.4097 | 14510030 | -0.00193968 | 0.506364 | 18.4005 |
| 2 | 14510027 | 0.499560 | 0.00486398 | 18.1603 | 14510026 | 0.00000 | 0.504424 | 18.0226 |
| 3 | 14510035 | 0.503012 | 0.00141197 | 18.0716 | 14510033 | 0.000201898 | 0.504222 | 17.9375 |
| 4 | 14510031 | 0.500351 | 0.00407296 | 17.9263 | 14510034 | 0.000698562 | 0.503725 | 17.6280 |
| 5 | 14510036 | 0.503600 | 0.000823975 | 17.6391 | 14510037 | 0.00384037 | 0.500584 | 17.0748 |
| 6 | 14510032 | 0.501786 | 0.00263798 | 17.2254 | 14510038 | 0.00389818 | 0.500526 | 16.5967 |