| Red | Green | Blue | |
| z | 17.64 | ||
| znorm | Inf | ||
| sky | -Inf | -Inf | -Inf |
| S/N | 18.8 | 36.0 | 38.9 |
| S/N(c) | 0.0 | 0.0 | 0.0 |
| SN(E/C) |
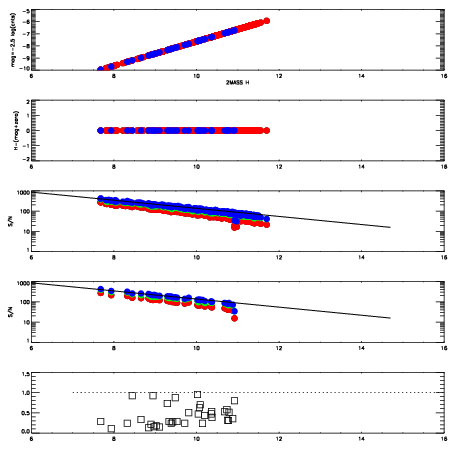
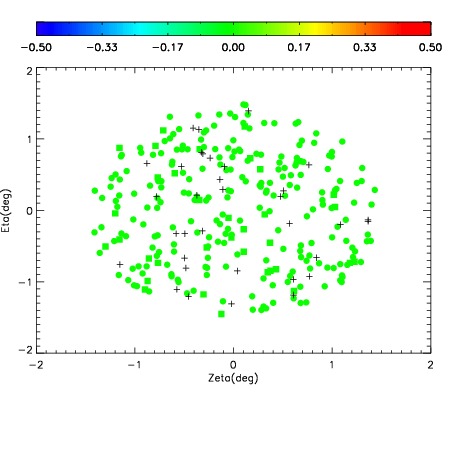
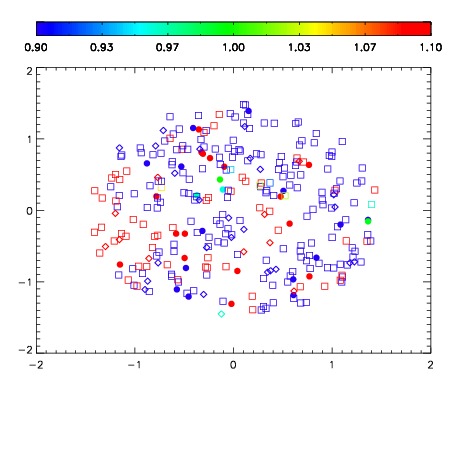
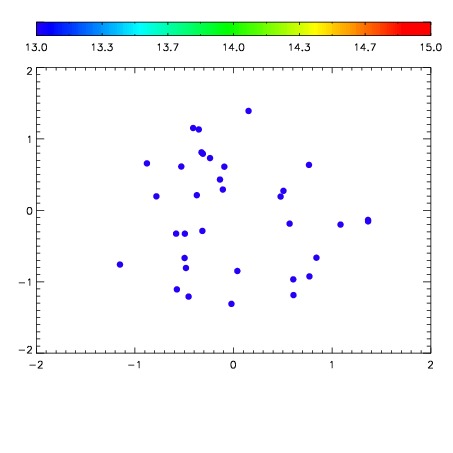

| Frame | Nreads | Zeropoints | Mag plots | Spatial mag deviation | Spatial sky 16325A emission deviations (filled: sky, open: star) | Spatial sky continuum emission | Spatial sky telluric CO2 absorption deviations (filled: H < 10) | |||||||||||||||||||||||
| 0 | 0 |
|
|
|
|
|
|
| IPAIR | NAME | SHIFT | NEWSHIFT | S/N | NAME | SHIFT | NEWSHIFT | S/N |
| 0 | 14580055 | 0.499972 | 0.00000 | 18.0520 | 14580056 | -0.000449207 | 0.500421 | 18.0763 |
| 1 | 14580058 | 0.499820 | 0.000151992 | 18.3241 | 14580057 | -0.00106364 | 0.501036 | 18.3224 |
| 2 | 14580063 | 0.498007 | 0.00196499 | 18.2906 | 14580064 | -0.00111752 | 0.501090 | 18.2997 |
| 3 | 14580054 | 0.498543 | 0.00142899 | 18.1338 | 14580053 | 0.00000 | 0.499972 | 18.2490 |
| 4 | 14580059 | 0.499498 | 0.000473976 | 18.1221 | 14580060 | -0.000830484 | 0.500802 | 18.0823 |
| 5 | 14580062 | 0.497983 | 0.00198898 | 17.9814 | 14580061 | -9.38958e-05 | 0.500066 | 18.0302 |