| Red | Green | Blue | |
| z | 17.64 | ||
| znorm | Inf | ||
| sky | -Inf | -Inf | -Inf |
| S/N | 34.8 | 59.6 | 66.8 |
| S/N(c) | 0.0 | 0.0 | 0.0 |
| SN(E/C) |
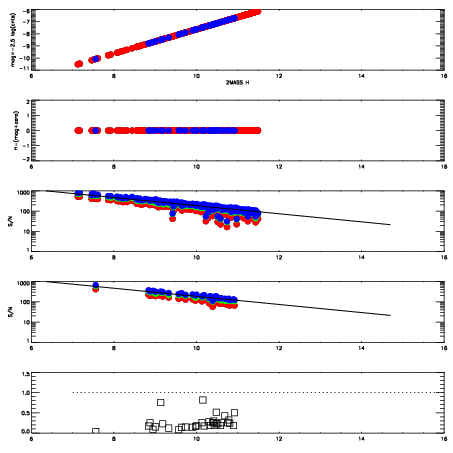
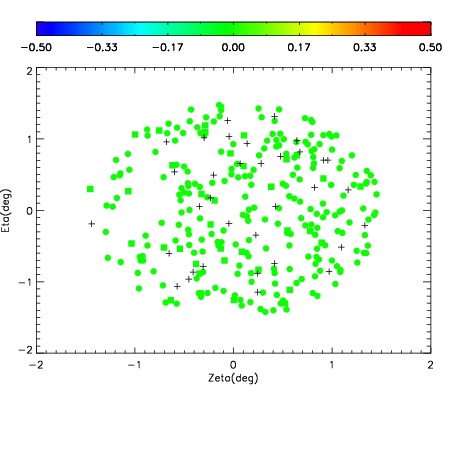
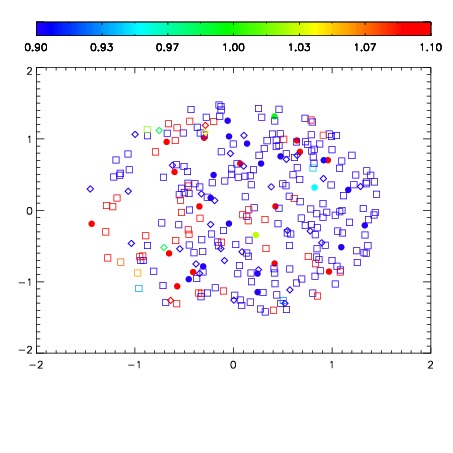
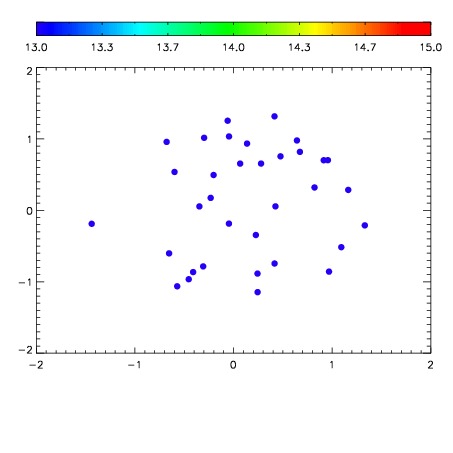

| Frame | Nreads | Zeropoints | Mag plots | Spatial mag deviation | Spatial sky 16325A emission deviations (filled: sky, open: star) | Spatial sky continuum emission | Spatial sky telluric CO2 absorption deviations (filled: H < 10) | |||||||||||||||||||||||
| 0 | 0 |
|
|
|
|
|
|
| IPAIR | NAME | SHIFT | NEWSHIFT | S/N | NAME | SHIFT | NEWSHIFT | S/N |
| 0 | 15600029 | 0.497061 | 0.00000 | 18.2853 | 15600031 | 0.00764960 | 0.489411 | 18.4037 |
| 1 | 15600021 | 0.493873 | 0.00318801 | 18.8949 | 15600022 | 0.00294855 | 0.494112 | 18.9204 |
| 2 | 15600028 | 0.494997 | 0.00206402 | 18.8730 | 15600027 | 0.00508462 | 0.491976 | 18.8232 |
| 3 | 15600012 | 0.490563 | 0.00649801 | 18.6388 | 15600015 | 0.00197421 | 0.495087 | 18.6908 |
| 4 | 15600033 | 0.496029 | 0.00103202 | 18.6015 | 15600011 | 0.00000 | 0.497061 | 18.6471 |
| 5 | 15600032 | 0.496120 | 0.000941008 | 18.3955 | 15600014 | 0.00191072 | 0.495150 | 18.6389 |
| 6 | 15600013 | 0.491982 | 0.00507900 | 18.3784 | 15600034 | 0.00685457 | 0.490206 | 18.5482 |
| 7 | 15600025 | 0.496701 | 0.000360012 | 18.1992 | 15600030 | 0.00722563 | 0.489835 | 18.2664 |
| 8 | 15600024 | 0.495666 | 0.00139502 | 17.9793 | 15600026 | 0.00670536 | 0.490356 | 18.1863 |
| 9 | 15600020 | 0.493946 | 0.00311503 | 17.9223 | 15600023 | 0.00411151 | 0.492950 | 17.9920 |
| 10 | 15600017 | 0.494163 | 0.00289801 | 17.7283 | 15600019 | 0.00346939 | 0.493592 | 17.9234 |