| Red | Green | Blue | |
| z | 17.64 | ||
| znorm | Inf | ||
| sky | -Inf | -Inf | -Inf |
| S/N | 10.3 | 19.3 | 22.0 |
| S/N(c) | 0.0 | 0.0 | 0.0 |
| SN(E/C) |
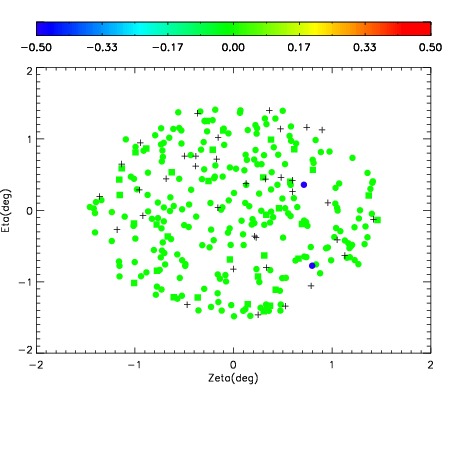
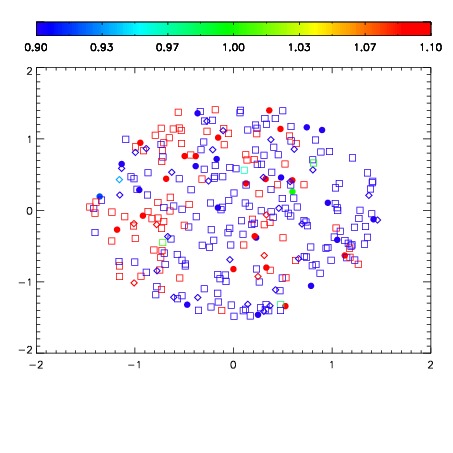
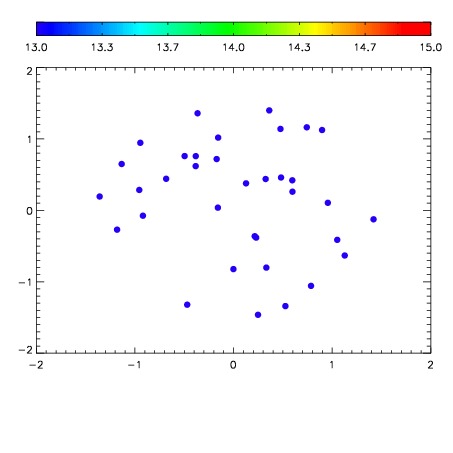

| Frame | Nreads | Zeropoints | Mag plots | Spatial mag deviation | Spatial sky 16325A emission deviations (filled: sky, open: star) | Spatial sky continuum emission | Spatial sky telluric CO2 absorption deviations (filled: H < 10) | |||||||||||||||||||||||
| 0 | 0 |
|
|
|
|
|
|
| IPAIR | NAME | SHIFT | NEWSHIFT | S/N | NAME | SHIFT | NEWSHIFT | S/N |
| 0 | 18380044 | 0.503734 | 0.00000 | 18.3842 | 18380045 | 0.00289569 | 0.500838 | 18.3331 |
| 1 | 18380043 | 0.503216 | 0.000517964 | 18.3360 | 18380042 | 0.00000 | 0.503734 | 18.2530 |
| 2 | 18380047 | 0.503077 | 0.000657022 | 17.4634 | 18380046 | 0.00251954 | 0.501214 | 17.5234 |