| Red | Green | Blue | |
| z | 17.64 | ||
| znorm | Inf | ||
| sky | -Inf | -Inf | -Inf |
| S/N | 19.4 | 34.9 | 40.7 |
| S/N(c) | 0.0 | 0.0 | 0.0 |
| SN(E/C) |
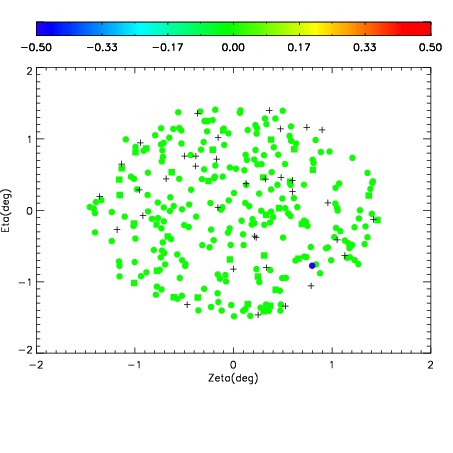
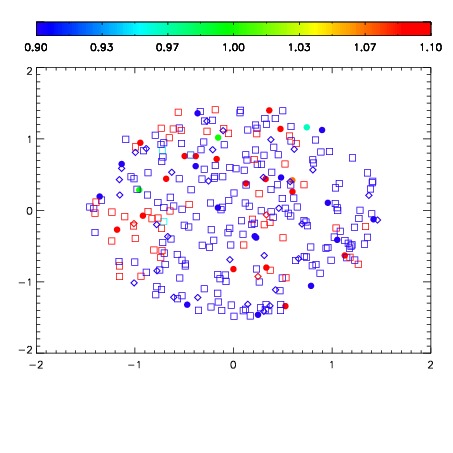
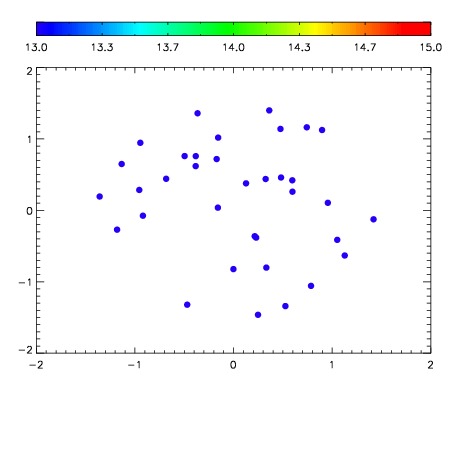

| Frame | Nreads | Zeropoints | Mag plots | Spatial mag deviation | Spatial sky 16325A emission deviations (filled: sky, open: star) | Spatial sky continuum emission | Spatial sky telluric CO2 absorption deviations (filled: H < 10) | |||||||||||||||||||||||
| 0 | 0 |
|
|
|
|
|
|
| IPAIR | NAME | SHIFT | NEWSHIFT | S/N | NAME | SHIFT | NEWSHIFT | S/N |
| 0 | 18390013 | 0.505450 | 0.00000 | 17.9344 | 18390014 | 0.00294557 | 0.502504 | 18.0543 |
| 1 | 18390016 | 0.503286 | 0.00216401 | 18.6148 | 18390015 | 0.00224402 | 0.503206 | 18.5193 |
| 2 | 18390021 | 0.504858 | 0.000591993 | 18.5674 | 18390022 | 0.00147002 | 0.503980 | 18.4931 |
| 3 | 18390020 | 0.505337 | 0.000113010 | 18.2285 | 18390019 | 0.00189092 | 0.503559 | 18.2280 |
| 4 | 18390017 | 0.503801 | 0.00164902 | 17.8814 | 18390018 | 0.00198811 | 0.503462 | 17.9996 |
| 5 | 18390012 | 0.504436 | 0.00101399 | 17.7932 | 18390011 | 0.00000 | 0.505450 | 17.7891 |