| Red | Green | Blue | |
| z | 17.64 | ||
| znorm | Inf | ||
| sky | -Inf | -Inf | -Inf |
| S/N | 20.2 | 36.0 | 37.3 |
| S/N(c) | 0.0 | 0.0 | 0.0 |
| SN(E/C) |
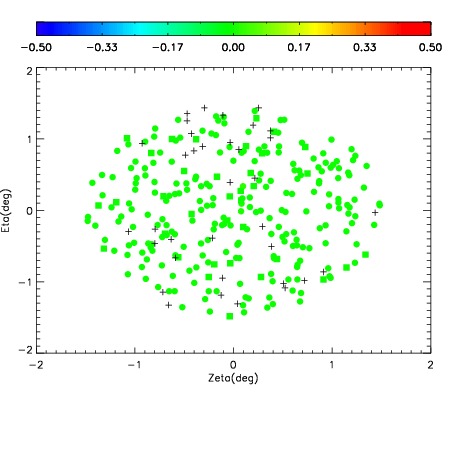
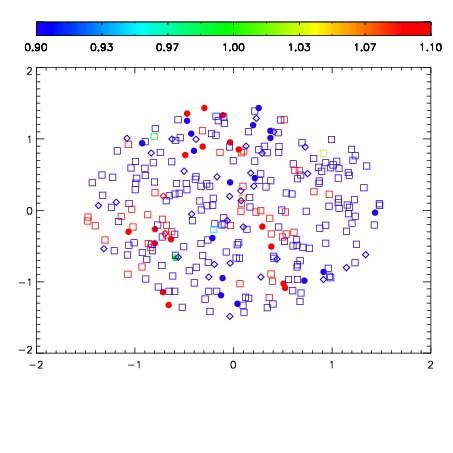
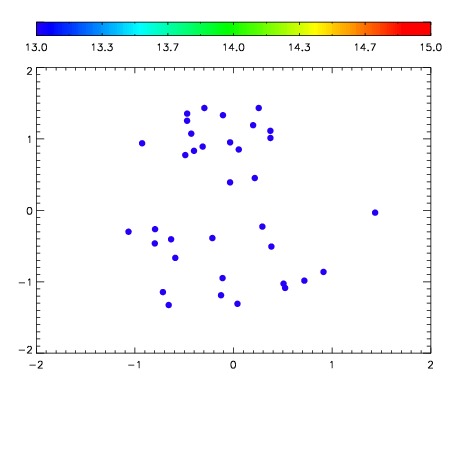

| Frame | Nreads | Zeropoints | Mag plots | Spatial mag deviation | Spatial sky 16325A emission deviations (filled: sky, open: star) | Spatial sky continuum emission | Spatial sky telluric CO2 absorption deviations (filled: H < 10) | |||||||||||||||||||||||
| 0 | 0 |
|
|
|
|
|
|
| IPAIR | NAME | SHIFT | NEWSHIFT | S/N | NAME | SHIFT | NEWSHIFT | S/N |
| 0 | 14580070 | 0.499265 | 0.00000 | 18.2653 | 14580071 | 0.000186853 | 0.499078 | 18.3015 |
| 1 | 14580074 | 0.497053 | 0.00221199 | 18.4535 | 14580068 | 0.00000 | 0.499265 | 18.3423 |
| 2 | 14580073 | 0.496760 | 0.00250497 | 18.3189 | 14580075 | -0.000891807 | 0.500157 | 18.3346 |
| 3 | 14580069 | 0.498952 | 0.000312984 | 18.2506 | 14580072 | -0.000409626 | 0.499675 | 18.2870 |