| Red | Green | Blue | |
| z | 17.64 | ||
| znorm | Inf | ||
| sky | -Inf | -Inf | -Inf |
| S/N | 18.6 | 33.5 | 34.4 |
| S/N(c) | 0.0 | 0.0 | 0.0 |
| SN(E/C) |
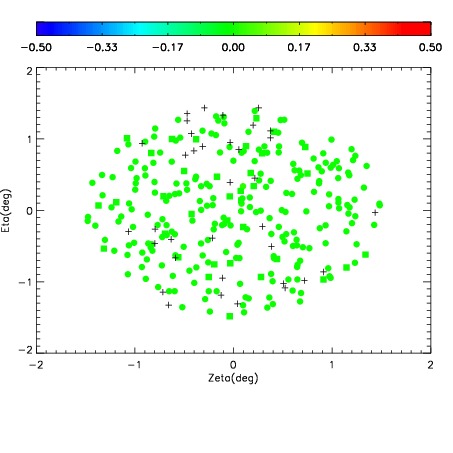
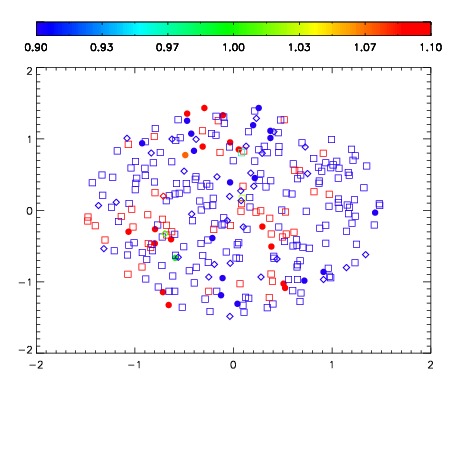
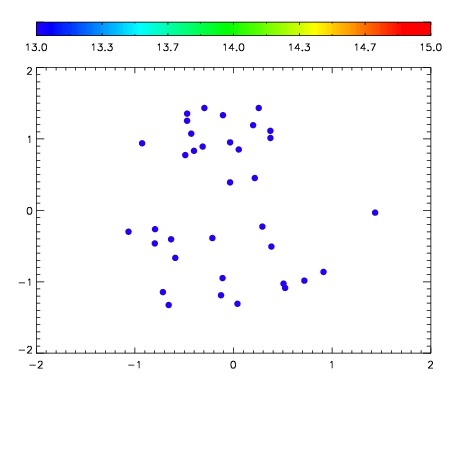

| Frame | Nreads | Zeropoints | Mag plots | Spatial mag deviation | Spatial sky 16325A emission deviations (filled: sky, open: star) | Spatial sky continuum emission | Spatial sky telluric CO2 absorption deviations (filled: H < 10) | |||||||||||||||||||||||
| 0 | 0 |
|
|
|
|
|
|
| IPAIR | NAME | SHIFT | NEWSHIFT | S/N | NAME | SHIFT | NEWSHIFT | S/N |
| 0 | 14590105 | 0.00202688 | 0.00000 | 18.4242 | 14590100 | -0.495776 | 0.497803 | 18.5241 |
| 1 | 14590102 | 0.00132174 | 0.000705140 | 18.4056 | 14590104 | -0.493354 | 0.495381 | 18.4543 |
| 2 | 14590101 | -0.000172189 | 0.00219907 | 18.3957 | 14590103 | -0.493518 | 0.495545 | 18.4323 |
| 3 | 14590098 | 0.00000 | 0.00202688 | 18.3026 | 14590099 | -0.496394 | 0.498421 | 18.3208 |