| Red | Green | Blue | |
| z | 17.64 | ||
| znorm | Inf | ||
| sky | -Inf | -Inf | -Inf |
| S/N | 0.7 | 0.5 | 0.7 |
| S/N(c) | 0.0 | 0.0 | 0.0 |
| SN(E/C) |
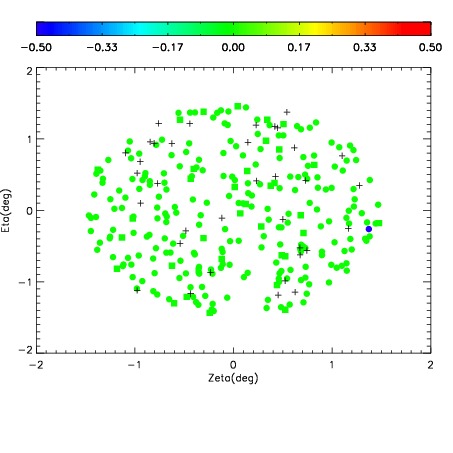
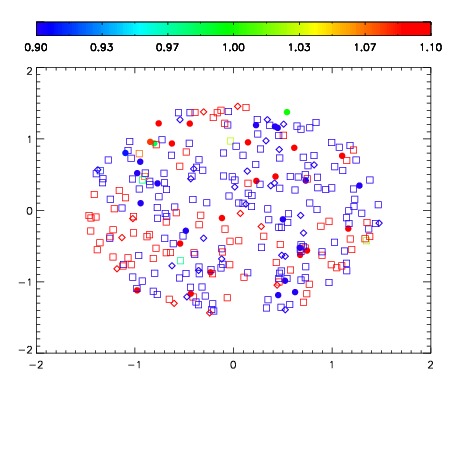
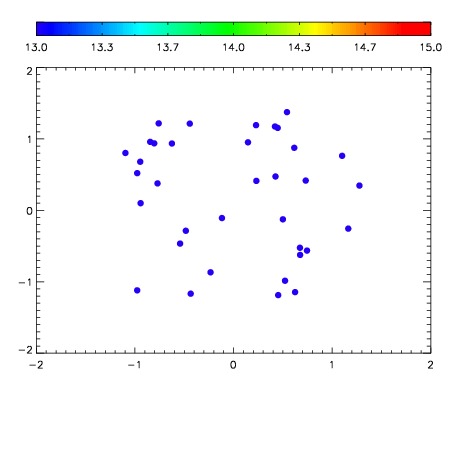

| Frame | Nreads | Zeropoints | Mag plots | Spatial mag deviation | Spatial sky 16325A emission deviations (filled: sky, open: star) | Spatial sky continuum emission | Spatial sky telluric CO2 absorption deviations (filled: H < 10) | |||||||||||||||||||||||
| 0 | 0 |
|
|
|
|
|
|
| IPAIR | NAME | SHIFT | NEWSHIFT | S/N | NAME | SHIFT | NEWSHIFT | S/N |
| 0 | 14850013 | 0.498936 | 0.00000 | 17.6093 | 14850018 | -0.00267044 | 0.501606 | 17.6885 |
| 1 | 14850029 | 0.496023 | 0.00291300 | 18.1247 | 14850015 | -0.00276328 | 0.501699 | 18.1571 |
| 2 | 14850030 | 0.496971 | 0.00196499 | 18.1000 | 14850028 | -0.00263605 | 0.501572 | 18.0822 |
| 3 | 14850021 | 0.496166 | 0.00277001 | 18.0517 | 14850031 | -0.00202159 | 0.500958 | 18.0724 |
| 4 | 14850016 | 0.495569 | 0.00336701 | 18.0219 | 14850022 | -0.00131016 | 0.500246 | 17.9956 |
| 5 | 14850025 | 0.497105 | 0.00183100 | 17.9823 | 14850026 | -0.00281157 | 0.501748 | 17.9822 |
| 6 | 14850033 | 0.496152 | 0.00278398 | 17.9263 | 14850032 | -0.00303236 | 0.501968 | 17.9814 |
| 7 | 14850024 | 0.496147 | 0.00278899 | 17.7576 | 14850014 | -0.00198191 | 0.500918 | 17.8625 |
| 8 | 14850020 | 0.496134 | 0.00280198 | 17.7207 | 14850023 | -0.00187479 | 0.500811 | 17.7003 |
| 9 | 14850017 | 0.495761 | 0.00317499 | 17.5955 | 14850019 | -0.00232903 | 0.501265 | 17.6756 |
| 10 | 14850012 | 0.497928 | 0.00100800 | 17.4861 | 14850011 | 0.00000 | 0.498936 | 17.5447 |