| Red | Green | Blue | |
| z | 17.64 | ||
| znorm | Inf | ||
| sky | -Inf | -Inf | -Inf |
| S/N | 0.2 | 0.0 | 0.5 |
| S/N(c) | 0.0 | 0.0 | 0.0 |
| SN(E/C) |
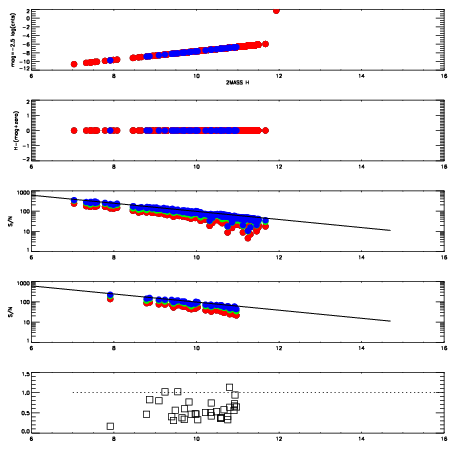


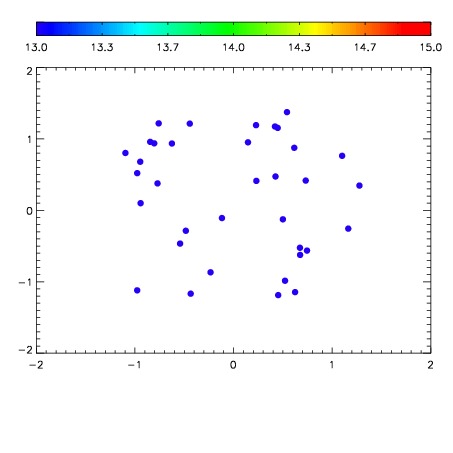

| Frame | Nreads | Zeropoints | Mag plots | Spatial mag deviation | Spatial sky 16325A emission deviations (filled: sky, open: star) | Spatial sky continuum emission | Spatial sky telluric CO2 absorption deviations (filled: H < 10) | |||||||||||||||||||||||
| 0 | 0 |
|
|
|
|
|
|
| IPAIR | NAME | SHIFT | NEWSHIFT | S/N | NAME | SHIFT | NEWSHIFT | S/N |
| 0 | 14860016 | 0.499566 | 0.00000 | 17.8990 | 14860015 | 0.000427914 | 0.499138 | 17.8319 |
| 1 | 14860012 | 0.497188 | 0.00237799 | 18.3423 | 14860011 | 0.00000 | 0.499566 | 18.4584 |
| 2 | 14860013 | 0.498533 | 0.00103298 | 17.5417 | 14860014 | 0.000380009 | 0.499186 | 17.6949 |