| Red | Green | Blue | |
| z | 17.64 | ||
| znorm | Inf | ||
| sky | -Inf | -NaN | -NaN |
| S/N | 0.4 | -0.0 | -0.0 |
| S/N(c) | 0.0 | 0.0 | 0.0 |
| SN(E/C) |
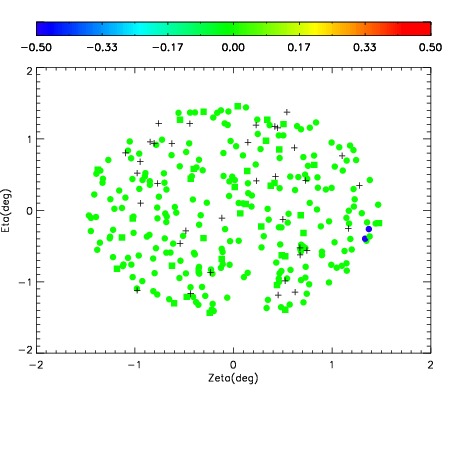


| Frame | Nreads | Zeropoints | Mag plots | Spatial mag deviation | Spatial sky 16325A emission deviations (filled: sky, open: star) | Spatial sky continuum emission | Spatial sky telluric CO2 absorption deviations (filled: H < 10) | |||||||||||||||||||||||
| 0 | 0 |
|
|
|
|
|
|
| IPAIR | NAME | SHIFT | NEWSHIFT | S/N | NAME | SHIFT | NEWSHIFT | S/N |
| 0 | 15050025 | 0.00628089 | 0.00000 | 18.4576 | 15050024 | -0.494793 | 0.501074 | 18.3665 |
| 1 | 15050030 | -4.29730e-05 | 0.00632386 | 18.4676 | 15050028 | -0.497790 | 0.504071 | 18.4142 |
| 2 | 15050029 | -0.00128669 | 0.00756758 | 18.4571 | 15050023 | -0.494718 | 0.500999 | 18.1762 |
| 3 | 15050022 | 0.00000 | 0.00628089 | 18.1634 | 15050031 | -0.496758 | 0.503039 | 18.1636 |
| 4 | 15050026 | 0.00560616 | 0.000674730 | 17.9771 | 15050027 | -0.497830 | 0.504111 | 17.8682 |
| 5 | 15050033 | 0.00214005 | 0.00414084 | 17.5761 | 15050032 | -0.496961 | 0.503242 | 17.8538 |