| Red | Green | Blue | |
| z | 17.64 | ||
| znorm | Inf | ||
| sky | -Inf | -NaN | -Inf |
| S/N | 0.1 | -0.0 | -0.0 |
| S/N(c) | 0.0 | 0.0 | 0.0 |
| SN(E/C) |
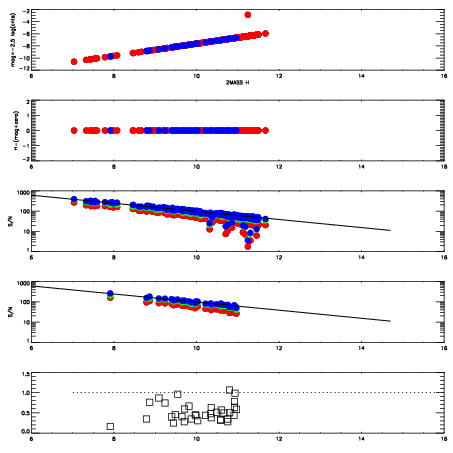
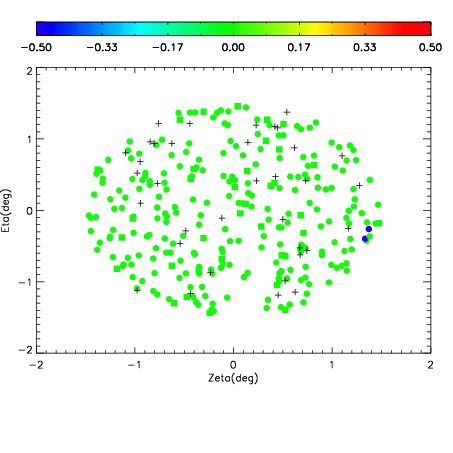
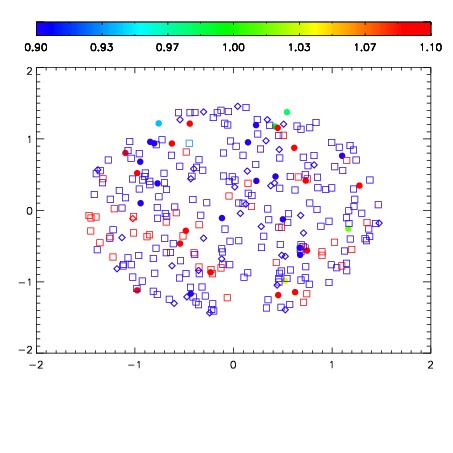
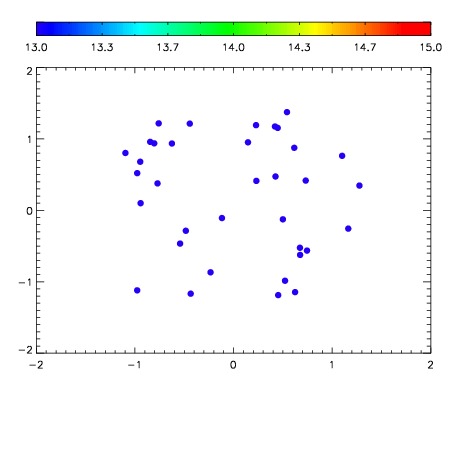

| Frame | Nreads | Zeropoints | Mag plots | Spatial mag deviation | Spatial sky 16325A emission deviations (filled: sky, open: star) | Spatial sky continuum emission | Spatial sky telluric CO2 absorption deviations (filled: H < 10) | |||||||||||||||||||||||
| 0 | 0 |
|
|
|
|
|
|
| IPAIR | NAME | SHIFT | NEWSHIFT | S/N | NAME | SHIFT | NEWSHIFT | S/N |
| 0 | 15090017 | 0.499432 | 0.00000 | 18.2502 | 15090018 | -0.00167451 | 0.501107 | 18.2068 |
| 1 | 15090020 | 0.498659 | 0.000772983 | 18.2637 | 15090019 | -0.00171392 | 0.501146 | 18.2800 |
| 2 | 15090016 | 0.498940 | 0.000492007 | 18.1782 | 15090015 | 0.00000 | 0.499432 | 18.1840 |