| Red | Green | Blue | |
| z | 17.64 | ||
| znorm | Inf | ||
| sky | -Inf | -NaN | -NaN |
| S/N | 26.7 | 46.3 | 45.3 |
| S/N(c) | 0.0 | 0.0 | 0.0 |
| SN(E/C) |

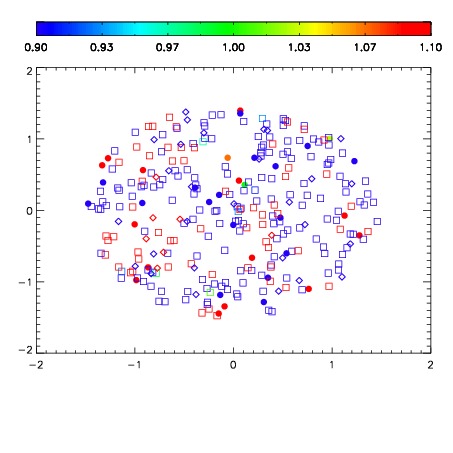


| Frame | Nreads | Zeropoints | Mag plots | Spatial mag deviation | Spatial sky 16325A emission deviations (filled: sky, open: star) | Spatial sky continuum emission | Spatial sky telluric CO2 absorption deviations (filled: H < 10) | |||||||||||||||||||||||
| 0 | 0 |
|
|
|
|
|
|
| IPAIR | NAME | SHIFT | NEWSHIFT | S/N | NAME | SHIFT | NEWSHIFT | S/N |
| 0 | 14790033 | 0.000531696 | 0.00000 | 17.5189 | 14790032 | -0.497176 | 0.497708 | 17.6628 |
| 1 | 14790029 | -0.00182197 | 0.00235367 | 18.5013 | 14790028 | -0.498614 | 0.499146 | 18.5488 |
| 2 | 14790022 | 0.00000 | 0.000531696 | 18.4396 | 14790031 | -0.497007 | 0.497539 | 18.4523 |
| 3 | 14790030 | -0.000513174 | 0.00104487 | 18.3482 | 14790023 | -0.498975 | 0.499507 | 18.3544 |
| 4 | 14790025 | -0.00123140 | 0.00176310 | 18.3087 | 14790024 | -0.498472 | 0.499004 | 18.2960 |
| 5 | 14790026 | -0.000916374 | 0.00144807 | 18.0087 | 14790027 | -0.498233 | 0.498765 | 17.9907 |