| Red | Green | Blue | |
| z | 17.64 | ||
| znorm | Inf | ||
| sky | -Inf | -Inf | -NaN |
| S/N | 29.1 | 49.8 | 48.9 |
| S/N(c) | 0.0 | 0.0 | 0.0 |
| SN(E/C) |
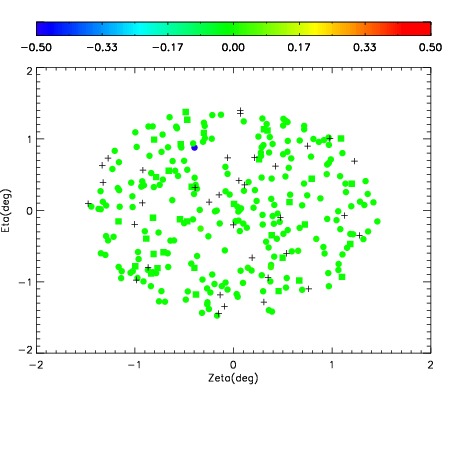


| Frame | Nreads | Zeropoints | Mag plots | Spatial mag deviation | Spatial sky 16325A emission deviations (filled: sky, open: star) | Spatial sky continuum emission | Spatial sky telluric CO2 absorption deviations (filled: H < 10) | |||||||||||||||||||||||
| 0 | 0 |
|
|
|
|
|
|
| IPAIR | NAME | SHIFT | NEWSHIFT | S/N | NAME | SHIFT | NEWSHIFT | S/N |
| 0 | 14800048 | 0.498255 | 0.00000 | 17.6316 | 14800049 | 0.00125421 | 0.497001 | 17.6120 |
| 1 | 14800039 | 0.497191 | 0.00106400 | 18.6644 | 14800038 | 0.00000 | 0.498255 | 18.6624 |
| 2 | 14800044 | 0.497775 | 0.000480026 | 18.5606 | 14800045 | 0.00123516 | 0.497020 | 18.5904 |
| 3 | 14800047 | 0.497966 | 0.000289023 | 18.4882 | 14800046 | 0.00122542 | 0.497030 | 18.5054 |
| 4 | 14800040 | 0.497751 | 0.000504017 | 18.4401 | 14800041 | 0.00106533 | 0.497190 | 18.4896 |
| 5 | 14800043 | 0.497657 | 0.000598013 | 17.8790 | 14800042 | 0.000844917 | 0.497410 | 17.9799 |