| Red | Green | Blue | |
| z | 17.64 | ||
| znorm | Inf | ||
| sky | -Inf | -Inf | -NaN |
| S/N | 25.3 | 44.7 | 49.4 |
| S/N(c) | 0.0 | 0.0 | 0.0 |
| SN(E/C) |
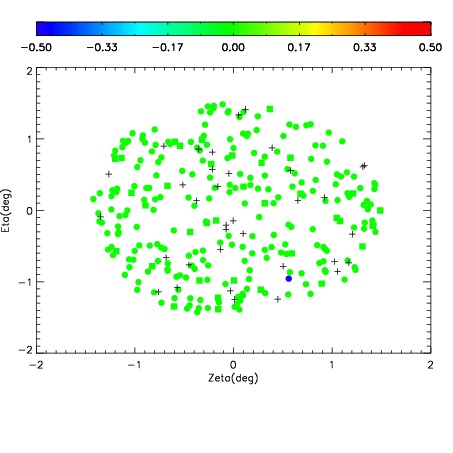

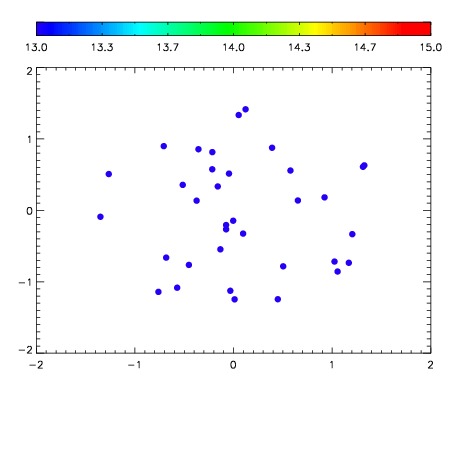

| Frame | Nreads | Zeropoints | Mag plots | Spatial mag deviation | Spatial sky 16325A emission deviations (filled: sky, open: star) | Spatial sky continuum emission | Spatial sky telluric CO2 absorption deviations (filled: H < 10) | |||||||||||||||||||||||
| 0 | 0 |
|
|
|
|
|
|
| IPAIR | NAME | SHIFT | NEWSHIFT | S/N | NAME | SHIFT | NEWSHIFT | S/N |
| 0 | 14840051 | 0.499876 | 0.00000 | 18.1578 | 14840052 | 0.00464752 | 0.495228 | 18.1923 |
| 1 | 14840047 | 0.496748 | 0.00312799 | 18.6017 | 14840048 | 0.00251373 | 0.497362 | 18.6437 |
| 2 | 14840050 | 0.499000 | 0.000875980 | 18.4896 | 14840049 | 0.00414404 | 0.495732 | 18.4798 |
| 3 | 14840042 | 0.494533 | 0.00534299 | 18.4493 | 14840041 | 0.00000 | 0.499876 | 18.4381 |
| 4 | 14840043 | 0.496294 | 0.00358200 | 18.3512 | 14840044 | 0.000639298 | 0.499237 | 18.3843 |
| 5 | 14840046 | 0.496434 | 0.00344199 | 18.3500 | 14840045 | 0.000369724 | 0.499506 | 18.3776 |