| Red | Green | Blue | |
| z | 17.64 | ||
| znorm | Inf | ||
| sky | -Inf | -Inf | -NaN |
| S/N | 5.5 | 11.2 | 12.3 |
| S/N(c) | 0.0 | 0.0 | 0.0 |
| SN(E/C) |


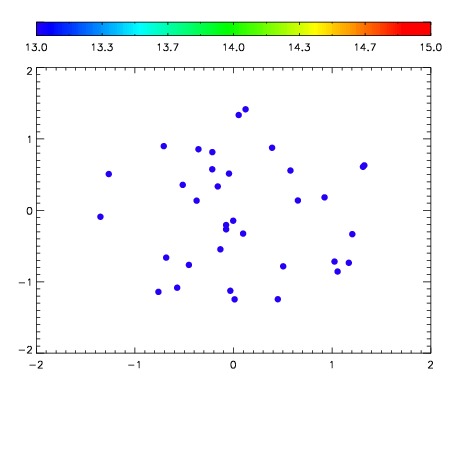

| Frame | Nreads | Zeropoints | Mag plots | Spatial mag deviation | Spatial sky 16325A emission deviations (filled: sky, open: star) | Spatial sky continuum emission | Spatial sky telluric CO2 absorption deviations (filled: H < 10) | |||||||||||||||||||||||
| 0 | 0 |
|
|
|
|
|
|
| IPAIR | NAME | SHIFT | NEWSHIFT | S/N | NAME | SHIFT | NEWSHIFT | S/N |
| 0 | 14850044 | 0.00260805 | 0.00000 | 14.4329 | 14850042 | -0.498699 | 0.501307 | 14.1650 |
| 1 | 14850037 | 0.00000 | 0.00260805 | 17.5912 | 14850038 | -0.498705 | 0.501313 | 17.4966 |
| 2 | 14850040 | 0.000397061 | 0.00221099 | 15.2866 | 14850039 | -0.498411 | 0.501019 | 15.7833 |
| 3 | 14850041 | 0.000941785 | 0.00166626 | 14.6751 | 14850046 | -0.497662 | 0.500270 | 14.6398 |
| 4 | 14850045 | 0.00249741 | 0.000110640 | 14.4401 | 14850043 | -0.499045 | 0.501653 | 14.3725 |