| Red | Green | Blue | |
| z | 17.64 | ||
| znorm | Inf | ||
| sky | -Inf | -Inf | -NaN |
| S/N | 24.3 | 47.4 | 51.5 |
| S/N(c) | 0.0 | 0.0 | 0.0 |
| SN(E/C) |


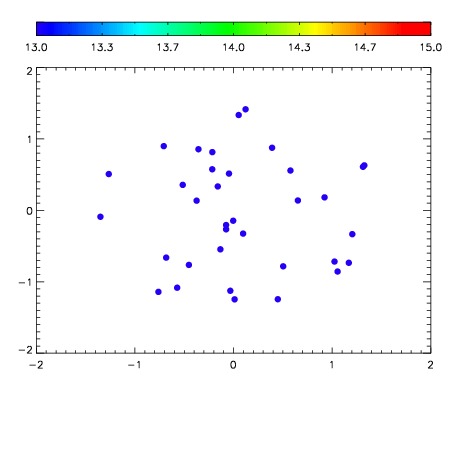

| Frame | Nreads | Zeropoints | Mag plots | Spatial mag deviation | Spatial sky 16325A emission deviations (filled: sky, open: star) | Spatial sky continuum emission | Spatial sky telluric CO2 absorption deviations (filled: H < 10) | |||||||||||||||||||||||
| 0 | 0 |
|
|
|
|
|
|
| IPAIR | NAME | SHIFT | NEWSHIFT | S/N | NAME | SHIFT | NEWSHIFT | S/N |
| 0 | 14860048 | 0.00704299 | 0.00000 | 17.3215 | 14860045 | -0.493306 | 0.500349 | 16.8101 |
| 1 | 14860035 | 0.000801618 | 0.00624137 | 18.3965 | 14860030 | -0.499852 | 0.506895 | 18.5106 |
| 2 | 14860031 | -0.000146362 | 0.00718935 | 18.2636 | 14860034 | -0.497503 | 0.504546 | 18.1849 |
| 3 | 14860024 | -0.000584009 | 0.00762700 | 18.2275 | 14860025 | -0.498192 | 0.505235 | 18.0846 |
| 4 | 14860036 | 0.00232139 | 0.00472160 | 17.7753 | 14860029 | -0.499392 | 0.506435 | 17.8797 |
| 5 | 14860028 | 0.00197396 | 0.00506903 | 17.7042 | 14860033 | -0.497636 | 0.504679 | 17.8622 |
| 6 | 14860043 | 0.00272322 | 0.00431977 | 17.7002 | 14860026 | -0.498662 | 0.505705 | 17.8575 |
| 7 | 14860032 | 0.000916555 | 0.00612644 | 17.6665 | 14860041 | -0.494575 | 0.501618 | 17.6669 |
| 8 | 14860039 | 0.00250672 | 0.00453627 | 17.4566 | 14860042 | -0.494419 | 0.501462 | 17.6222 |
| 9 | 14860020 | 0.00000 | 0.00704299 | 17.4333 | 14860037 | -0.496366 | 0.503409 | 17.5225 |
| 10 | 14860040 | 0.00323049 | 0.00381250 | 17.4135 | 14860038 | -0.496593 | 0.503636 | 17.4658 |
| 11 | 14860027 | 0.00132451 | 0.00571848 | 17.4107 | 14860021 | -0.500487 | 0.507530 | 17.0293 |
| 12 | 14860023 | -0.000453729 | 0.00749672 | 17.3405 | 14860046 | -0.493176 | 0.500219 | 16.9031 |
| 13 | 14860047 | 0.00663520 | 0.000407790 | 17.0226 | 14860049 | -0.492885 | 0.499928 | 16.7985 |
| 14 | 14860044 | 0.00454182 | 0.00250117 | 16.8818 | 14860022 | -0.500522 | 0.507565 | 16.7203 |