| Red | Green | Blue | |
| z | 17.64 | ||
| znorm | Inf | ||
| sky | -Inf | -Inf | -NaN |
| S/N | 14.6 | 26.6 | 29.5 |
| S/N(c) | 0.0 | 0.0 | 0.0 |
| SN(E/C) |


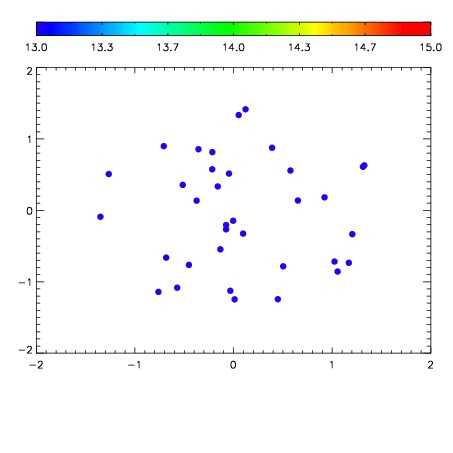

| Frame | Nreads | Zeropoints | Mag plots | Spatial mag deviation | Spatial sky 16325A emission deviations (filled: sky, open: star) | Spatial sky continuum emission | Spatial sky telluric CO2 absorption deviations (filled: H < 10) | |||||||||||||||||||||||
| 0 | 0 |
|
|
|
|
|
|
| IPAIR | NAME | SHIFT | NEWSHIFT | S/N | NAME | SHIFT | NEWSHIFT | S/N |
| 0 | 15050013 | 0.496687 | 0.00000 | 17.6567 | 15050011 | 0.00000 | 0.496687 | 17.7975 |
| 1 | 15050016 | 0.494386 | 0.00230101 | 18.6113 | 15050015 | -0.00271916 | 0.499406 | 18.6147 |
| 2 | 15050012 | 0.494893 | 0.00179398 | 17.8791 | 15050014 | -0.00130428 | 0.497991 | 17.8200 |