| Red | Green | Blue | |
| z | 17.64 | ||
| znorm | Inf | ||
| sky | -Inf | -Inf | -Inf |
| S/N | 24.9 | 48.4 | 50.5 |
| S/N(c) | 0.0 | 0.0 | 0.0 |
| SN(E/C) |

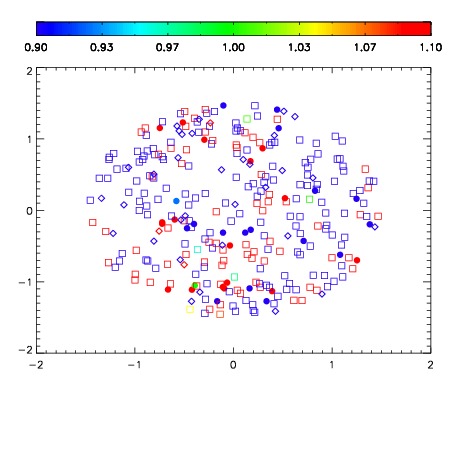


| Frame | Nreads | Zeropoints | Mag plots | Spatial mag deviation | Spatial sky 16325A emission deviations (filled: sky, open: star) | Spatial sky continuum emission | Spatial sky telluric CO2 absorption deviations (filled: H < 10) | |||||||||||||||||||||||
| 0 | 0 |
|
|
|
|
|
|
| IPAIR | NAME | SHIFT | NEWSHIFT | S/N | NAME | SHIFT | NEWSHIFT | S/N |
| 0 | 15340028 | 0.491792 | 0.00000 | 17.9929 | 15340029 | 0.00152269 | 0.490269 | 18.0054 |
| 1 | 15340031 | 0.490684 | 0.00110799 | 18.3412 | 15340030 | 0.000355763 | 0.491436 | 18.3756 |
| 2 | 15340036 | 0.490196 | 0.00159600 | 18.2705 | 15340038 | -0.00421468 | 0.496007 | 18.2526 |
| 3 | 15340039 | 0.488386 | 0.00340599 | 18.2512 | 15340037 | -0.00400661 | 0.495799 | 18.1586 |
| 4 | 15340044 | 0.487189 | 0.00460300 | 18.1374 | 15340033 | -0.00186999 | 0.493662 | 18.1477 |
| 5 | 15340035 | 0.490008 | 0.00178400 | 18.1334 | 15340026 | 0.00000 | 0.491792 | 18.1182 |
| 6 | 15340040 | 0.489236 | 0.00255600 | 18.0854 | 15340041 | -0.00580410 | 0.497596 | 18.1132 |
| 7 | 15340043 | 0.487567 | 0.00422499 | 18.0362 | 15340034 | -0.00160390 | 0.493396 | 18.1086 |
| 8 | 15340047 | 0.487394 | 0.00439799 | 18.0166 | 15340045 | -0.00678852 | 0.498581 | 18.1084 |
| 9 | 15340032 | 0.491149 | 0.000642985 | 18.0070 | 15340046 | -0.00548918 | 0.497281 | 18.0810 |
| 10 | 15340027 | 0.490778 | 0.00101399 | 18.0054 | 15340042 | -0.00522140 | 0.497013 | 18.0324 |
| 11 | 15340048 | 0.487536 | 0.00425598 | 17.7589 | 15340049 | -0.00522063 | 0.497013 | 17.7770 |