| Red | Green | Blue | |
| z | 17.64 | ||
| znorm | Inf | ||
| sky | -Inf | -Inf | -Inf |
| S/N | 24.5 | 45.3 | 48.8 |
| S/N(c) | 0.0 | 0.0 | 0.0 |
| SN(E/C) |
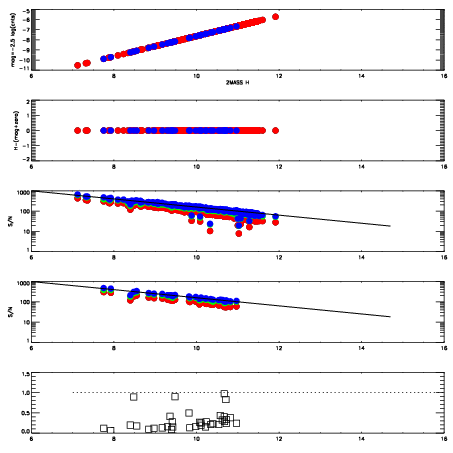
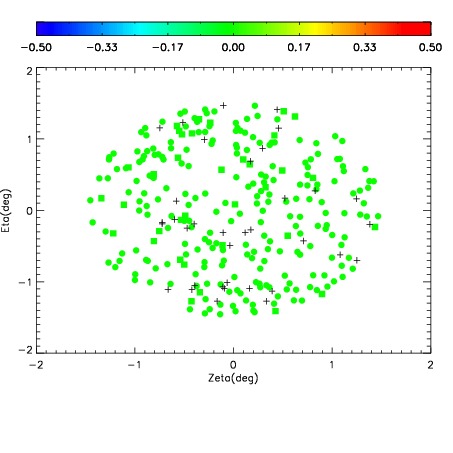
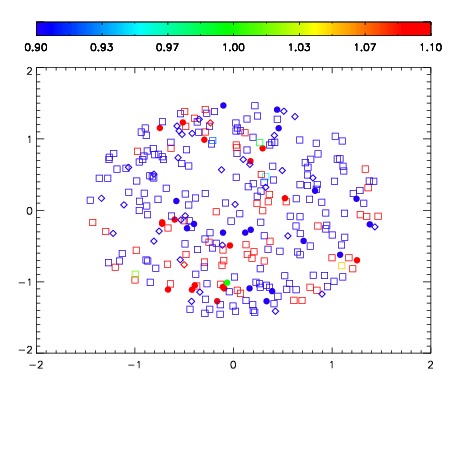
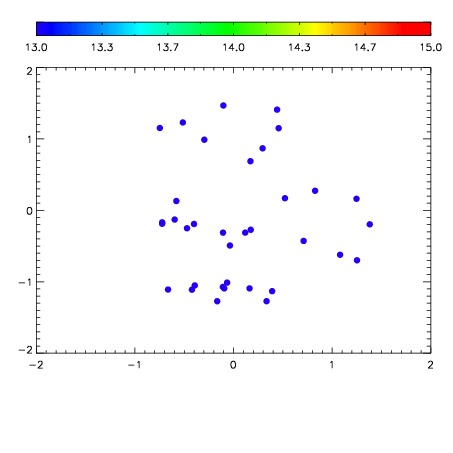

| Frame | Nreads | Zeropoints | Mag plots | Spatial mag deviation | Spatial sky 16325A emission deviations (filled: sky, open: star) | Spatial sky continuum emission | Spatial sky telluric CO2 absorption deviations (filled: H < 10) | |||||||||||||||||||||||
| 0 | 0 |
|
|
|
|
|
|
| IPAIR | NAME | SHIFT | NEWSHIFT | S/N | NAME | SHIFT | NEWSHIFT | S/N |
| 0 | 15430038 | 0.000919891 | 0.00000 | 17.9720 | 15430035 | -0.495381 | 0.496301 | 17.9981 |
| 1 | 15430042 | 0.000340723 | 0.000579168 | 18.6844 | 15430043 | -0.495794 | 0.496714 | 18.6538 |
| 2 | 15430047 | -0.000325187 | 0.00124508 | 18.4708 | 15430048 | -0.496817 | 0.497737 | 18.5082 |
| 3 | 15430046 | -0.000553088 | 0.00147298 | 18.4659 | 15430045 | -0.496176 | 0.497096 | 18.4494 |
| 4 | 15430041 | 0.000706476 | 0.000213415 | 18.3493 | 15430049 | -0.496882 | 0.497802 | 18.3657 |
| 5 | 15430050 | -0.00338567 | 0.00430556 | 18.2566 | 15430040 | -0.494682 | 0.495602 | 18.3008 |
| 6 | 15430037 | 0.000851778 | 6.81130e-05 | 17.9838 | 15430039 | -0.494481 | 0.495401 | 18.0440 |
| 7 | 15430034 | 0.00000 | 0.000919891 | 17.7849 | 15430036 | -0.495600 | 0.496520 | 17.4842 |