| Red | Green | Blue | |
| z | 17.64 | ||
| znorm | Inf | ||
| sky | -Inf | -Inf | -NaN |
| S/N | 20.1 | 38.3 | 40.7 |
| S/N(c) | 0.0 | 0.0 | 0.0 |
| SN(E/C) |
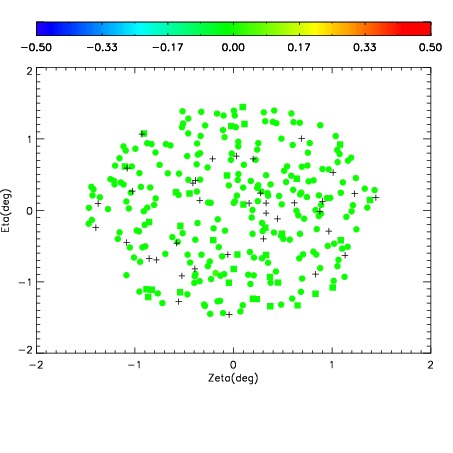
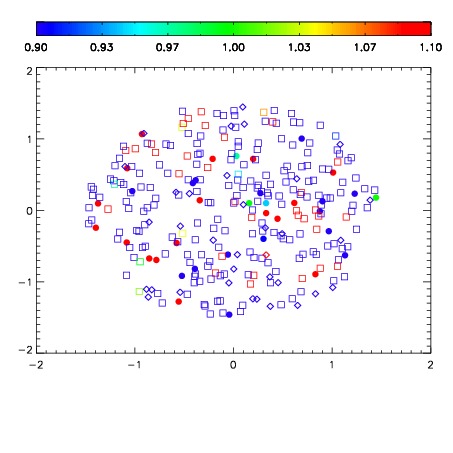
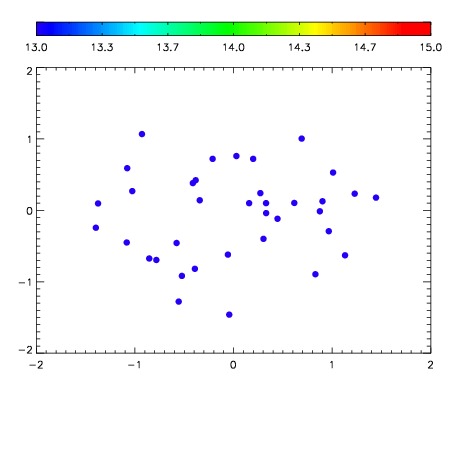

| Frame | Nreads | Zeropoints | Mag plots | Spatial mag deviation | Spatial sky 16325A emission deviations (filled: sky, open: star) | Spatial sky continuum emission | Spatial sky telluric CO2 absorption deviations (filled: H < 10) | |||||||||||||||||||||||
| 0 | 0 |
|
|
|
|
|
|
| IPAIR | NAME | SHIFT | NEWSHIFT | S/N | NAME | SHIFT | NEWSHIFT | S/N |
| 0 | 18720071 | 0.511573 | 0.00000 | 18.3417 | 18720070 | 0.00387745 | 0.507696 | 18.3278 |
| 1 | 18720068 | 0.507867 | 0.00370604 | 18.4849 | 18720069 | 0.00309236 | 0.508481 | 18.4029 |
| 2 | 18720063 | 0.505056 | 0.00651699 | 18.2732 | 18720066 | 0.00126276 | 0.510310 | 18.2858 |
| 3 | 18720064 | 0.506696 | 0.00487703 | 18.1855 | 18720065 | 0.00201224 | 0.509561 | 18.2572 |
| 4 | 18720067 | 0.506211 | 0.00536203 | 18.1242 | 18720062 | 0.00000 | 0.511573 | 18.2332 |